| Issue |
A&A
Volume 698, June 2025
|
|
|---|---|---|
| Article Number | A279 | |
| Number of page(s) | 21 | |
| Section | Stellar atmospheres | |
| DOI | https://doi.org/10.1051/0004-6361/202453571 | |
| Published online | 20 June 2025 | |
Investigating episodic mass loss in evolved massive stars
III. Spectroscopy of dusty massive stars in three northern galaxies
1
IAASARS, National Observatory of Athens,
I. Metaxa & Vas. Pavlou St.,
15236
Penteli, Athens,
Greece
2
Department of Physics, National and Kapodistrian University of Athens, Panepistimiopolis,
Zografos
15784,
Greece
3
Institute of Astrophysics, FORTH,
71110
Heraklion,
Greece
4
Instituto de Astrofísica de Canarias, Avenida Vía Láctea,
38205
La Laguna, Tenerife,
Spain
5
Grantecan S. A., Centro de Astrofísica de La Palma, Cuesta de San José,
38712
Breña Baja, La Palma,
Spain
6
Royal Observatory of Belgium, Avenue Circulaire,
Ringlaan 3,
1180
Brussels,
Belgium
7
University of Liège,
Allée du 6 Août 19c (B5C),
4000
Sart Tilman, Liège,
Belgium
8
Department of Physics, University of Oxford,
Oxford,
UK
★★ Corresponding author.
Received:
20
December
2024
Accepted:
22
April
2025
Abstract
Mass loss in massive stars is crucial to understanding how these stars evolve and explode. Despite increasing evidence of its importance, episodic mass loss remains poorly understood. Here we report the results of an optical spectroscopic survey of evolved massive stars in NGC 6822, IC 10, and IC 1613 conducted as part of the ASSESS project (Episodic Mass Loss in Evolved Massive Stars: Key to Understanding the Explosive Early Universe), which investigated the role of episodic mass loss by targeting stars with infrared excesses indicating a dusty circumstellar environment. We assigned a spectral class to 122 unique sources, the majority of which are dusty. The rate of evolved massive stars was over 60% for the highest-priority targets. We discovered two blue supergiants, one yellow supergiant, and one emission-line object, and confirmed two supernova remnant candidates, a Wolf–Rayet star, and two H II regions. Twenty-eight unique sources were classified as red supergiants (RSGs), 21 of which are new discoveries. In IC 10, we increased the sample of spectroscopically confirmed RSGs from 1 to 17. We used the MARCS models to obtain their surface properties, most importantly the effective temperature, and used spectral energy distribution fitting to obtain the stellar luminosity for 17 of them. The dusty RSGs are cooler, more luminous, more extinguished, and more evolved than the non-dusty ones, in agreement with previous findings. By investigating the optical photometric variability of the RSGs from light curves that cover a period of over a decade, we found that the dusty RSGs are more variable. We further highlight a very extinguished emission-line object, two RSGs that display a significant change in spectral type between two observed epochs, and four dusty K-type RSGs that may have undergone episodic mass loss.
Key words: catalogs / circumstellar matter / stars: evolution / stars: massive / stars: mass-loss / supergiants
These authors contributed equally and should be considered joint first authors.
© The Authors 2025
 Open Access article, published by EDP Sciences, under the terms of the Creative Commons Attribution License (https://creativecommons.org/licenses/by/4.0), which permits unrestricted use, distribution, and reproduction in any medium, provided the original work is properly cited.
This article is published in open access under the Subscribe to Open model. This email address is being protected from spambots. You need JavaScript enabled to view it. to support open access publication.
1 Introduction
Massive stars lose a significant fraction of their mass as they evolve. For stars between 8 and 30 M⊙, mass is gradually lost through stationary, line-driven winds in the OB phase (e.g., Castor et al. 1975; Vink et al. 2000; Vink & Sander 2021) and through stronger winds during the red supergiant (RSG) phase (e.g., de Jager et al. 1988; van Loon et al. 2005; Beasor et al. 2020; Yang et al. 2023; Antoniadis et al. 2024). The evolution of such stars (e.g., whether they transition to yellow hypergiants; Yoon & Cantiello 2010; Koumpia et al. 2020; Humphreys et al. 2023), their supernova explosion characteristics (Smartt et al. 2009; Smartt 2015; Förster et al. 2018), and the properties of the resulting compact object (Sukhbold et al. 2016; Vink & Sander 2021) are all affected by the degree of mass loss.
Reductions in the observed mass-loss rates in both the OB phase (Fullerton et al. 2006; Cohen et al. 2014; Telford et al. 2024) and the RSG phase (Beasor et al. 2020; Antoniadis et al. 2024; Decin et al. 2024) suggest that mass lost through stationary winds is inadequate to strip stars of their hydrogenrich envelopes. Evidence of episodic mass loss (Smith 2014) is mounting from theory (e.g., Cheng et al. 2024) and direct observations of massive stars (e.g., Ohnaka et al. 2008; Gvaramadze et al. 2010; Montargès et al. 2021; Munoz-Sanchez et al. 2024a), superluminous supernovae (Gal-Yam 2012; Neill et al. 2011; Gal-Yam 2019), and supernova “imposters” (e.g., SN2009ip; Mauerhan et al. 2013; Smith et al. 2022).
Hints of ongoing or recent epochs of enhanced mass loss in RSGs may lie in their circumstellar environments (Ohnaka et al. 2008; Montargès et al. 2021; Dupree et al. 2022; Decin et al. 2024). The presence of infrared (IR) excesses due to recent dust formation provides a laboratory to study mass-losing RSGs with increased surface activity (Ma et al. 2024; Drevon et al. 2024). Pulsations (Yoon & Cantiello 2010), convective cycles (Josselin & Plez 2007; Kravchenko et al. 2019), radiation pressure on molecules (Arroyo-Torres et al. 2015), and turbulence (Josselin & Plez 2007; Kee et al. 2021) are all thought to contribute to the surface conditions that enable mass loss. Therefore, the large-scale characterization of RSG surfaces is crucial to understanding which RSGs have the conditions for episodic mass loss and how frequent these episodes are. The latter has implications for the duration of such a phase, whereas the surface properties may be linked to the stage of the RSG evolution during which this occurs.
The ASSESS project1 (Episodic Mass Loss in Evolved Massive Stars: Key to Understanding the Explosive Early Universe) has so far observed and classified 185 evolved massive stars (Bonanos et al. 2024) and modeled 127 RSGs (de Wit et al. 2024) to obtain their properties. Additionally, the project has conducted spectroscopic and photometric variability studies of extreme RSGs such as [W60] B90 and WOH G64 (Munoz-Sanchez et al. 2024a,b, respectively) to understand their variable nature and the connection to episodic mass loss. This paper aims to increase the number of classified evolved massive stars, from which the classified RSGs are modeled, by presenting and analyzing spectra from three galaxies in our northern survey: NGC 6822, IC 10, and IC 1613. Section 2 presents the target selection, observations, and data reduction. Section 3 provides the spectral classification for each object and the catalog. Section 4 presents RSG luminosities, optical light curves, and the RSG properties determined from modeling, and we discuss them in Sect. 5. Section 6 summarizes our findings.
Properties of the target galaxies.
2 Observations and data reduction
2.1 Target selection
Table 1 presents the properties of the target galaxies (i.e., IC 10, IC 1613, and NGC 6822), such as coordinates, distance, diameter (i.e., the size of the galaxy based on visual inspection) used to match the catalogs, the oxygen abundance log(O/H), and metallicity Z. For NGC 6822, we built the catalog and selected the targets using the CosmicFlows-2 distance of 0.48 Mpc (Tully et al. 2013). An updated distance (0.45 ± 0.01 Mpc; Zgirski et al. 2021) was published after our observations; hence, we used it in the analysis (see Sect. 4). We selected targets using multiwavelength photometric catalogs. We began with Spitzer IR catalogs from Khan et al. (2015) for NGC 6822 and Boyer et al. (2015) for IC 10 and IC 1613. We cross-matched them using a 1″ radius with Gaia astrometry (Gaia Collaboration 2016, 2018), optical photometry (Pan-STARRS1; Chambers et al. 2016), and near-IR photometry. For the near-IR photometry, we used the UK InfraRed Telescope Hemisphere Survey (Dye et al. 2018; Irwin 2013) for IC 10 and the VISTA Hemisphere Survey (McMahon 2012) for NGC 6822. No data were available for IC 1613. We used the photometric datasets for the target selection and Gaia to identify and remove foreground sources.
We applied the criteria presented by Bonanos et al. (2024), which rely on early road maps from Bonanos et al. (2009, 2010) showing the separation of classes of evolved massive stars based on their mid-IR colors. First, we considered sources with [3.6] − [4.5] ≥ 0.1 mag, corresponding to dusty sources and excluding foreground stars (see, e.g., Britavskiy et al. 2015). Then, cuts in the absolute magnitude M3.6 ≤ −9.0 mag and the apparent magnitude of [4.5] ≤ 15.5 mag were applied to exclude contamination from the asymptotic giant branch (AGB) stars and background sources (such as galaxies and quasars), respectively. We assigned a priority scheme (from P1 to P6) depending on the mid-IR color, absolute magnitude criteria, and the presence of optical or near-IR counterparts (see Bonanos et al. 2024 for details). The highest priority candidates, P1 and P2, correspond to the brightest IR sources with strong and moderate IR excess, respectively. Table A.1 presents the distribution of priorities for all the available targets, as well as for the observed targets in each field of multi-object spectroscopy (MOS) and long-slit observation. Overall, we observed 97 priority targets: 42 targets in IC 10 (34% of the total available priority targets), 3 targets in IC 1613 (18% of the total), and 52 targets in NGC 6822 (54% of the total). We had a notable coverage of the highest-priority classes, with 9 P1 and 5 P2 targets (60% and 71% of the total, respectively).
2.2 Pre-imaging and mask design (MOS)
We obtained the spectra for a large number of targets with the MOS mode of the Optical System for Imaging and low-Intermediate-Resolution Integrated Spectroscopy (OSIRIS; Cepa et al. 2000, 2003) at the 10.4 m Gran Telescopio Canarias (GTC), at La Palma, Canary Islands.
During our first observing campaign (proposal ID 115-GTC83/20A, PI: N. Britavskiy) MOS observations were carried out for IC 10 and NGC 6822. We first acquired short exposures (10–15 s in the r filter) of the fields to be observed. This pre-imaging, combined with the Mask Designer tool (v. 3.262), helped us securely identify targets in the field of view and design the mask (i.e., the positions of the slits). We used the 1000R grism and a 1.2″ slit width, which yielded a spectral resolving power (R = λ/Δλ) of ~600–1000, depending on the seeing (see Table A.2), over the wavelength range of 5300–9000 Å. The resolution and wavelength coverage provide access to a large number of spectral features critical for spectral classification (see Sect. 3). Targets at the edges of the detector yield a more limited spectral range. The pointings were chosen to maximize the number of P1 and P2 targets to be observed. Additional space on each mask was filled with lower-priority targets.
For the second campaign (proposal ID 29-GTC34/22A, PI: D. García-Álvarez), the MOS observing mode was not available. However, we were able to secure several long-slit observations for a selection of targets in IC 10, IC 1613, and NGC 6822. For these, we used the 1000 R grism and a 0.8″ slit width, achieving R ~ 1000. Whenever possible, we placed two targets in the slit. In all cases, we used the standard bias, flat-field, and arc exposures provided by the observatory.
Table A.2 presents the observing log for all OSIRIS preimaging, MOS, and long-slit observations, providing the coordinates of the field center for MOS spectra or of the target for long-slit spectra, the UT date, modified Julian date, mode, exposure time, airmass, and seeing for each observation.
Distribution of classified targets per galaxy and spectral class.
2.3 Data reduction
We performed the data reduction of the MOS observations in two steps. First, we used the GTCMOS package (an IRAF3 based pipeline, Gómez-González et al. 2016) to merge the images from each CCD4 and subtract the bias. Due to an offset between the flat field and the science images, which compromised the sky subtraction process in the narrow slits by creating artifacts close to the edges of the slits, we discarded the flat correction. We therefore proceeded to manually reduce the spectra using the IRAF tasks IDENTIFY, REIDENTIFY, FITCOORDS, and TRANSFORM to get a 2D-wavelength calibrated image, and APALL to extract the spectra. We flux-calibrated the extracted spectra with the flux standard by using the tasks STANDARD, SENSFUNC, and CALIBRATE. We followed the same manual approach to reduce the long-slit spectra. For both the MOS and long-slit observations, serendipitous extracted stars, which do not fall into any priority category, are labeled “right” (i.e., random) in Table A.1 (e.g., IC10-R1). We computed and applied the heliocentric correction with RVCORRECT.
3 Spectral classification and stellar content
Out of the 163 spectra, we classified 124 into broad classes, following the procedure and criteria described by Bonanos et al. (2024). The other 39 spectra could not be classified due to their low S/N. Two sources were reobserved (IC10-5660 and IC10-9165) with the OSIRIS long-slit mode due to their apparent brightness and late RSG type (see Sect. 3.1), yielding 122 unique sources classified. 15 targets out of the 122 were classified more generally, like a nebula or a red source. Table 2 presents the distribution of classified targets (107) for both robust classifications (85) and candidates (22) per galaxy and spectral class. Figure 1 shows the spatial distribution of the H II regions, carbon stars, and evolved massive stars and Fig. 2 their location in the color-magnitude diagrams. Note, particularly in IC 10, that the absolute magnitudes MG and M3.6 are not corrected for foreground extinction (AV = 4.3 mag, Schlafly & Finkbeiner 2011).
Table 3 presents the catalog, including all 122 spectroscopically classified targets. The targets are sorted by galaxy name and the ID, which is based on [4.5] (see Bonanos et al. 2024, for a description). The columns of Table 3 indicate the J2000 coordinates (in degrees), the observed field, assigned priority, Gaia DR3 photometry, Gaia DR3 astrometry (Gaia Collaboration 2023), Spitzer photometry (Fazio et al. 2004; Rieke et al. 2004), Pan-STARRS1 DR2 photometry (Chambers et al. 2016), UKIRT Hemisphere Survey photometry (Dye et al. 2018), the VISTA Hemisphere Survey photometry (McMahon 2012, NGC 6822 only), median absolute deviations (MAD; see Sect. 4.2), spectral type, previous classifications from the literature and comments on the spectral classification of each source. Previous classifications from the literature were obtained by cross-matching our sources using the VizieR catalog access tool and a 1″ radius. The catalog includes 21 newly discovered RSGs and 4 other evolved massive stars.
3.1 RSG classification
We classified the RSGs more precisely than the other classes following the classification criteria by de Wit et al. (2024). In addition to those criteria, if a strong Ca II triplet was observed and its radial velocity corresponded to that of the host galaxy, the sources were robustly classified as RSGs. We securely classified 14 targets as RSGs and verified that their modeled properties agreed with the expected range of properties for RSGs in these galaxies. However, we added a colon after the luminosity indicator (e.g., K5–M0 I:) when the S/N was low at the Ca II triplet or at least one modeled property was outside the expected range (e.g., their surface gravity was too high, or the recovered E(B − V) too low, in the case of IC 10). We considered the other 14 RSGs as candidates, given that oxygen-rich AGB stars are likely contaminants (reaching up to log (L/L⊙) ~ 5.0, but with weaker Ca II lines; Groenewegen & Sloan 2018).
The 28 verified and candidate RSGs include sixteen in IC 10, two in IC 1613, and ten in NGC 6822. We classified them as: one GK I, two K0–K5 I, three K5–M0 I, fourteen M0-M2 I, six M2–M4 I, and four M4–M6 I (see some examples in Fig. 3). The criteria for the M4–M6 I class were not presented by de Wit et al. (2024) as their spectra did not cover the TiO band starting around λ8430. Typically, when this TiO band dominates the absorption in the I band, stars are classified with spectral types ranging from M4 to M6 (Solf 1978). The targets classified twice (IC10-5660 and IC10-9165) shifted from M4–M6 I in their MOS spectrum (August 2020) to M0–M2 in their long-slit spectrum (August 2022), significantly changing their TiO band strengths. The GK I supergiant (IC1613-28306) lacks TiO bands, and the “forest” of metallic lines from λλ5500–6500 indicated a slightly hotter source, bordering the yellow supergiant (YSG) class. However, some individual spectral lines (e.g., Hα) are too strong for such a star, hinting at a potential binary component. These spectra are modeled for their stellar properties in Sect. 4.3.
We find the average spectral type of the sample to be M0–M2 I, which agrees with that expected at Z~0.3 (Levesque & Massey 2012) and increases the sample at this metallicity. The metallicity dependence of the average spectral type, and, subsequently, of the effective temperature, was first reported by Elias et al. (1985) and is due to the shift of the Hayashi limit to higher temperatures at low metallicities. The small fraction of K-type RSGs (21%) can also be attributed to the absolute magnitude selection criteria, as we mainly targeted bright RSGs. These are more likely to exhibit higher mass loss rates, increasing the TiO band strengths and shifting the RSGs to later types (Davies & Plez 2021).
Seven out of the 28 RSGs were previously reported in the literature: IC1613-28306, NGC 6822-52, NGC 6822-55, NGC 6822-66, NGC 6822-70, NGC 6822-103, and NGC 6822-175 (Massey 1998; Massey et al. 2007; Levesque & Massey 2012; Patrick et al. 2015; Chun et al. 2022). IC10-66828 is located in a known cluster (Tikhonov & Galazutdinova 2009). Kacharov et al. (2012) classified NGC 6822-248 as an M6 III star, but they only distinguished between foreground (V) and giant (III) stars; hence, our classification supersedes it. Finally, only one spectroscopically confirmed RSG was previously known in IC 10 (Britavskiy et al. 2019); therefore, by adding 16 RSGs, our work has significantly increased the RSG sample in this galaxy.
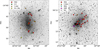 |
Fig. 1 Spatial distribution of classified sources in NGC 6822 (left) and IC 10 (right); background images are from DSS2-red. |
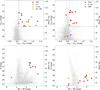 |
Fig. 2 Near-IR and optical color-magnitude diagrams of classified sources. We show the locations of classified targets with Spitzer IRAC photometry for NGC 6822 (top left) and IC 10 (top right) and with Gaia photometry for NGC 6822 (bottom left) and IC 10 (bottom right). The dashed lines indicate the priority criteria from Bonanos et al. (2024). IC10-52406 is the only RSG that shows no IR excess, as it was a serendipitous observation. |
Spectral classifications.
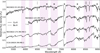 |
Fig. 3 OSIRIS spectra of classified RSGs. We show four RSGs with increasing TiO absorption strengths, which highlights the spectral type sequence of RSGs. Purple-shaded areas indicate regions with TiO absorption. A ⊕ marks telluric absorption. |
3.2 Other sources
We identified two blue supergiants (BSGs) and a YSG in the sample (see Fig. B.1): IC1613-8006 (A I–III), IC1613-6612 (AFG I–III), and IC10-21061 (BA I). The Paschen absorption series in the spectra of IC1613-8006 and IC10-21061 indicated a spectral type A. In contrast, metal lines in the spectrum of IC1613-6612 suggested a cooler, YSG candidate. The slope of IC10-21061 was severely reddened due to the foreground extinction, but its significantly blue-shifted Hα emission line profile supported the extragalactic supergiant classification. Additionally, we classified IC10-R15 as a Wolf–Rayet star based on the strong C IV feature at 5800 Å, which agrees with the previous classification from (Crowther et al. 2003).
We classified 17 carbon stars in our sample, of which 13 are robust classifications. Each of these exhibited strong CN absorption bands in the R and I-bands, occasionally displaying the Swan C2 bands if the signal in the blue was high enough (see Fig. B.2; NGC 6822-170 and NGC 6822-387).
We classified three spectra as supernova remnants (SNRs) in IC 10. These spectra have emission lines (e.g., Hα, [S II], and [N II]) of nebular origin. The emission line ratios indicate a shock-ionization mechanism ([S II]/Hα ≥ 0.4), most commonly observed in SNRs (Kopsacheili et al. 2020). IC10-R23 matches the location of the radio source [YS93] HL20b (Yang & Skillman 1993), a known SNR. The other two are located where other SNR candidates have been reported from radio observations (Yang & Skillman 1993); hence, our optical spectra confirm their nature.
Figure B.3 plots the H II regions and Fig. B.4 the emission line object NGC 6822-106. The latter shows strong emission features but differs from those observed in the H II regions (e.g., [Ar III] and He I lines are absent, Ca II triplet in emission). NGC 6822-48 is a well-studied extended H II region (Hubble V; Hubble 1925; Rubin et al. 2016), hosting an O-star in the center with visible He II absorption lines (i.e., He II λ5412), while NGC 6822-169 is a known compact H II region (Region γ; Kinman et al. 1979).
3.3 High-priority sources
We highlight the highest-priority classified targets (P1 and P2), potentially very dusty evolved massive stars, which occupy the reddest region of Fig. 2.
Three of the nine P1 targets could not be classified due to their low S/N. We found three RSGs, one K0–K5 I (IC10-26089) and two M0–M2 I (NGC 6822-66 and NGC 6822-103), an H II region (NGC 6822-48), an emission line object (NGC 6822-106), and a star of spectral type M5–M9 (NGC 6822-77). Regarding NGC 6822-77, the lack of a visible Ca II triplet and its late spectral type suggest a foreground dwarf. We could not verify this with Gaia due to the absence of proper motion data.
From the five P2 targets, three were classified as cool RSGs (NGC 6822-70; M2–M4 I and NGC 6822-52 and IC10-26929; M4–M6 I), suggesting these are evolved, mass-losing RSGs (de Wit et al. 2024). The remaining two targets were classified as a carbon star (IC10-50206) and a cluster (NGC 6822-234), known as Hubble VII (Hubble 1925), which may contain a large amount of dust causing the apparent IR excess.
4 Properties of RSGs
4.1 SED fitting
We used the photometry presented in Table 3 to construct the spectral energy distribution (SED) of each RSG. We also added the median value of the time-series photometry from the Zwicky Transient Facility (ZTF; Bellm et al. 2019). Following the procedure described by de Wit et al. (2024), the magnitudes were corrected for foreground Galactic extinction from Schlafly & Finkbeiner (2011) in their respective bands. We fitted the observed SED with a Planck function to obtain the total observed flux. We adopted a distance of 0.77 ± 0.02 Mpc for IC 10 (McQuinn et al. 2017), 0.74 ± 0.03 Mpc for IC 1613 (Górski et al. 2011), and 0.45 ± 0.01 Mpc for NGC 6822 (Zgirski et al. 2021) to convert the observed flux into an intrinsic flux, yielding the bolometric luminosity. Table 4 presents the obtained luminosity, log (L/L⊙), of 17 RSGs through this SED fitting, and Fig. C.1 shows their fits. We could not obtain the luminosity for 11 RSGs because of the poor photometric coverage of their SED or contaminated photometry due to low spatial resolution.
None of the upper luminosity limits exceed or are even close to the observed upper luminosity limit of log (L/L⊙) ~5.5 for cool supergiants (Davies et al. 2018; McDonald et al. 2022). The two RSGs that show a large shift in their TiO band strengths (IC10-5660 and IC10-9165) have high log (L/L⊙) ~5.3, which indicates a very evolved state (Davies et al. 2013).
4.2 Light curves
We constructed light curves of the RSGs to search for correlations of variability with mass loss (e.g., Yang et al. 2018; Antoniadis et al. 2024). Optical multi-epoch photometry from Gaia DR3, ZTF, the Asteroid Terrestrial-impact Last Alert System (ATLAS; Tonry et al. 2018), and Pan-STARRS1 DR2 were collected; the ZTF and ATLAS data from the same night were binned by taking the median magnitude per night. Figure 4 presents the light curve of the well-sampled NGC 6822-55, while Fig. D.1 plots the light curves of the other 19 RSGs. Four targets in IC 10 are only well-sampled in the izy bands due to the high foreground extinction. The cadence provided by the ZTF light curves is sufficient to study their periodicity (see the analysis of seven targets by Christodoulou et al. 2025). Fig D.2 shows the transmission curves of each filter as a reference.
We computed the MAD of each RSG in the ZTF-r, ATLAS-o, and G bands (Table 3) and present the MAD versus magnitude in Fig. 5. To calculate the MAD, we require a target to have at least two measurements in one band, with an uncertainty of less than 0.1 mag. We considered a RSG as a certain variable when the MAD value is at least 1σ above the general distribution for a given magnitude. The most variable RSGs in our sample (NGC 6822-52, NGC 6822-55, and IC10-63627) are also among the most luminous (log (L/L⊙) > 5.10) and, therefore, are expected to have the highest mass-loss rates. For the two most luminous RSGs (IC10-5660 and IC10-9165), we are missing either the coverage or high-quality photometry needed to properly assess their variability. Additionally, NGC 6822-175 exhibits high variability despite having a lower luminosity (log(L/L⊙) = 4.80 ± 0.05). The low-mass RSGs (i.e., 10 M⊙) only reach log (L/L⊙) ≈ 5.0; hence, NGC 6822-175 might be an evolved low-mass RSG, explaining its large variability. On the other hand, we found extreme short-timescale variability – commonly seen in AGB stars – in two RSG candidates (NGC 6822-151 and IC1613-23465) and the confirmed NGC 6822-248. We could not determine the luminosity of NGC 6822-151; the other two RSGs have low luminosities of log (L/L⊙) < 4.50, which is in the range where RSGs and massive AGB stars overlap (see Sect. 5.1 for more discussion).
Stellar parameters of the RSG sample.
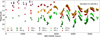 |
Fig. 4 Multi-survey optical light curve of NGC 6822-52. Apparent magnitudes from Pan-STARRS1 DR2 (triangles: gri), Gaia DR3 (circles: G, BP, RP), ZTF (upper triangles: g, r), and ATLAS (diamonds: c, o) are shown. The vertical dashed line indicates the epoch of the OSIRIS spectroscopy. |
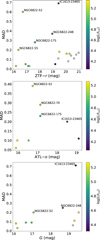 |
Fig. 5 MAD vs. magnitude diagram of RSGs in the ZTF–r (top), ATLAS-o (middle), and Gaia-G (bottom) bands. Variable RSGs with firm classifications are labeled. |
4.3 Grid of models and the spectral fitting method
To obtain the properties of the RSGs, we fitted MARCS model atmospheres (Gustafsson et al. 2008) to our spectra. The wavelength range covers the Ca II (i.e., λ8498, λ8542, and λ8662) triplet and multiple TiO bands (i.e., λ6150, λ6650, λ7050, λ7700, and λ8420), constraining on the surface gravity (log g) and effective temperature (Teff), respectively. We used the spherical MARCS model grid presented by de Wit et al. (2024), ranging from 3300–4500 K and −0.5 to 1.0 for the Teff and log g, respectively. For the metallicity, we approximated the observed values for NGC 6822 (Z = 0.3 Z⊙; Patrick et al. 2015), IC 10 (Z = 0.3 Z⊙; Polles et al. 2019) and IC 1613 (Z = 0.2 Z⊙; Bresolin et al. 2007) to the closest metallicity of our model grid ((Z/Z⊙) = −0.5 dex). We modeled Teff, log g, the color excess E(B − V), and the radial velocity of the system vrad as free parameters. We fixed Z to break its degeneracy with the Teff when using the TiO bands.
Each model was down-sampled to match the resolving power of the data: R ~ 800 for the MOS data and R ~ 1000 for the long-slit spectra. Similar to de Wit et al. (2023), we first fitted the Ca II triplet to constrain log g separately from the other parameters. The inclusion of the log g in the main fit, containing all regions of the spectrum, tends to overestimate its value. We then fixed the log g when fitting the TiO bands for Teff and the spectral slope for E(B − V). Lastly, we obtained vrad from a cross-correlation of the model to the spectrum.
To fit the models to each star, we used ULTRANEST (Buchner 2021), a Bayesian nested sampling approach (Skilling 2004) to establish the maximum likelihood model for each star. For each parameter, we assume a flat prior. ULTRANEST then computes the posterior distributions for each free parameter (Teff, log g, vrad, and E(B − V)) and finds physical correlations between each parameter pair. Specifically for Teff, ULTRANEST obtained unrealistically low uncertainties; therefore, we adopted a minimal uncertainty of 50 K.
4.4 Modeled properties
Table 4 presents the best-fit properties of the 30 RSG spectra. Figure 6 shows an example fit for NGC 6822-66, a dusty P1 target classified as M0–M2 I. The top panel shows the quality of the best-fit MARCS model to our spectrum, illustrating the reliability of the derived extinction coefficients and effective temperature. The bottom panel zooms in on the Ca II triplet, showing the reliability of the derived surface gravity and radial velocity. Figure E.1 shows the other fitted spectra.
Stars with fitting problems were assigned one of four flags (see the third column of Table 4). Two spectra cannot be reproduced by the MARCS models (flag = 1) either because the TiO bands were too extreme (NGC 6822-52) or because we obtained an unreliable fit by eye (IC10-66828). Several stars have a weaker Ca II triplet, either due to a strong TiO band hiding the strength of the absorption line (Teff ≲ 3400 K), or because their envelopes have not yet fully expanded, assuming that these are indeed RSGs. These then yielded values of log g near the upper limit of the grid at log g = 1.0. Therefore, only the lower limits of their respective surface gravities could be derived (flag = 2). Some RSGs show TiO bands in minor disagreement with the MARCS models, yielding trustworthy results (flag = 3). Finally, some spectra had bad Ca II triplet fits, yielding unreliable values for the surface gravity (flag = 4). Uncertain classifications with high surface gravities may be reclassified in the future as oxygen-rich AGB contaminants. Finally, IC10-R3 may be a foreground star, given that such a high S/N (the highest in our RSG sample) is not expected for a low-luminosity RSG.
MOS spectra suffered from wavelength calibration issues due to a reduced wavelength range for slits near the edges and the rotator angle, which can induce shifts and therefore systematic errors up to 60 km s−1. Due to this, the spread in radial velocities of sources in IC 10 is large, while for the long-slit spectra, the spread is more realistic. This issue explains the vrad difference between the MOS and long-slit observations of IC10-5660 and IC10-9165.
Following de Wit et al. (2024), we computed the stellar radius and reported it in the last column of Table 4. Figure 7 compares the luminosity and radius for the present sample with the results from de Wit et al. (2024). The figure includes WOH G64 (Ohnaka et al. 2008; Levesque et al. 2009), the largest, most dusty RSG known in the Local Group, with a mass-loss rate of ~10−4 M⊙yr−1, before its transition to a yellow hypergiant (Munoz-Sanchez et al. 2024b). The smallest source (IC1613-28306) was classified as a GK supergiant, possibly indicating a star at the beginning of the RSG phase.
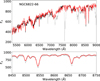 |
Fig. 6 MARCS model (red) fitted to the spectrum of NGC 6822-66 (black). Gray regions are excluded from the fit due to contamination by telluric absorption. Fλ is in units of 10−18 erg cm−2 s−1 A−1. Top: overall OSIRIS spectrum. Bottom: zoom in on the Ca II triplet. |
5 Discussion
The fraction of evolved massive stars among the classified P1 and P2 targets is 67% and 60%, respectively, confirming the success of our priority system. The fractions decrease down to 37% for P5 and 17% for random targets. In particular, the P5 class suffered from extra contamination of five carbon stars and an H II region in the NGC 6822 sample. We could have avoided this by using the newest distance available for this galaxy (0.45 ± 0.01 Mpc, Zgirski et al. 2021). All priority-selected RSGs were P1, P2, or P5. Finally, H II regions were found to contaminate the P1 and P5 targets (as in Bonanos et al. 2024).
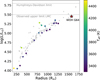 |
Fig. 7 Radius vs. luminosity of the RSGs in the sample. Gray sources are from the ASSESS southern sample (de Wit et al. 2024). The color indicates the effective temperature. The extreme WOH G64 in its RSG state is shown as a reference. |
5.1 Evolutionary diagrams
To compare the obtained properties to model predictions, we constructed Hertzsprung-Russell (HR) diagrams. We computed evolutionary tracks at Z ~ 0.2 Z⊙ using the grid of Posydon models (Fragos et al. 2023; Andrews et al. 2024) to match the metallicities of the RSGs in the sample. Following de Wit et al. (2024), we assumed an exponential convective core overshoot, stellar winds that follow the “Dutch” recipe (de Jager et al. 1988; Vink et al. 2001), a mixing length fixed at αMLT = 1.93, and no stellar rotation. The tracks evolve until the end of carbon-core burning.
Figure 8 compares the positions of the 17 RSGs for which we derived their luminosity to four illustrative tracks and to the RSGs in NGC 55 from de Wit et al. (2024). The top panel shows Teff based on TiO-band fits. We included IC10-5660 and IC10-9165 twice since we measured their temperature from two spectral epochs. Most sources occupy the forbidden zone, the cool region to which the evolutionary tracks do not extend. This result has been reproduced by many studies (e.g., Davies et al. 2013; de Wit et al. 2024) and is thought to be connected to the mass loss of RSGs affecting the optical temperature diagnostics (Davies & Plez 2021). Moreover, if the metallicity of the RSGs differs significantly from the default assumed value for each galaxy, Teff,TiO is affected. However, this cannot explain the systematic discrepancies, given that the effect of metallicity is symmetric (i.e., shifting temperatures to both slightly lower and higher values).
We then applied the scaling relations from de Wit et al. (2024) to ten RSGs to scale the Teff,TiO up to more representative values. The remainder of the RSGs were dropped after this point, as the relations can only be applied to RSGs in the range 3450–3950 K. We show the i-band-scaled temperatures and J-band-scaled temperatures in the middle and bottom panels of Fig. 8, respectively. In contrast to de Wit et al. (2024), the hotter J-band-scaled temperatures align better with the evolutionary predictions, strengthening the argued use of the J-band diagnostics to measure the effective temperature from RSG spectra. However, similar to de Wit et al. (2024), we refrain from a firm conclusion based on the evolutionary tracks alone, given the plethora of assumptions going into the POSYDON models. Christodoulou et al. (2025) have performed a J-band spectral analysis for NGC 6822-55, NGC 6822-70, NGC 6822-103, and NGC 6822-175, determining more accurate temperatures of these RSGs.
Four of our low-luminosity RSGs (IC10-20296, IC10-R3, IC1613-23465, and NGC 6822-248) are too cool to reconcile with the 8 M⊙ track. Their low temperature cannot be explained by mass loss alone because the low-luminosity RSGs are expected to experience weak winds (e.g., Antoniadis et al. 2024). Optical photometry was not available for IC10-20296 and IC10-R3, but the large amplitude and short-timescale variability of IC1613-23465 and NGC 6822-248 differ from those of the other RSGs. Among them, only NGC 6822-248 was robustly classified as a RSG based on spectral features. RSGs and AGB stars overlap in luminosity between 4.0 < log(L/L⊙) < 4.5, and hence, these four targets might be evolved stars with masses <8 M⊙. A more detailed study of these four objects is needed to determine their nature.
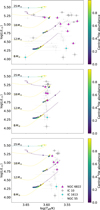 |
Fig. 8 HR diagram of RSGs in NGC 6822, IC 10, and IC 1613 compared to RSGs in NGC 55 (de Wit et al. 2024). Four Posydon evolutionary tracks for Z/Z⊙ = 0.2 are overplotted; the color indicates the central helium abundance, while dots indicate intervals of 10,000 yr. Each panel includes effective temperatures determined using the following methods: TiO-band fits (top), the i-band scaling relation applied to our TiO temperatures (middle), and the J-band scaling relation (bottom). |
5.2 Dusty RSGs
Clues of episodic mass loss may lie in the circumstellar dust. We consider a RSG dusty when its IR [3.6] − [4.5] color exceeds 0.1 mag and its absolute magnitude M3.6 ≤ −9.0 mag. Out of the 28 RSGs, 20 satisfy both of these criteria, 7 random targets classified as RSGs did not have mid-IR photometry, and 1 random target had blue mid-IR colors. We compared the properties of the dusty RSGs to the statistics presented by de Wit et al. (2024). They reported a median temperature of 3570 K for 27 dusty RSGs compared to a median temperature of 3630 K for 84 non-dusty RSGs. Considering the 20 known dusty RSGs in our sample (with two duplicate measurements; 22 measured effective temperatures), we found a median temperature of 3533 K, which agrees with the findings of de Wit et al. (2024). This is approximately 100 K cooler than the non-dusty RSGs. This temperature difference could be due to the effect of mass loss, which simultaneously increases the molecular absorption (lowering Teff) and provides fresh dust to the circumstellar environment.
For the extinction, we used RV = 3.1 to convert the E(B − V) to AV, although the real value of the total-to-selective extinction may be higher for the circumstellar environments of massive stars (e.g., Massey et al. 2005; Maíz Apellániz et al. 2014; Brands et al. 2023). Given the large foreground extinction of IC 10, we cannot reliably compare the median AV of our sample to those presented by de Wit et al. (2024). For this comparison, we only include RSGs from NGC 6822 and IC 1613. We calculate a median extinction of this sample of 11 dusty RSGs of AV = 0.53 mag, compared to the AV = 1.08 mag from the previous work for dusty RSGs and AV = 0.46 mag for non-dusty RSGs. Despite the conservative criteria, we still find a marginally higher median extinction than the non-dusty sample. None of the 11 RSGs passes the criteria to be considered a dust-enshrouded RSG (Beasor & Smith 2022; de Wit et al. 2024).
Lastly, de Wit et al. (2024) reported a median log (L/L⊙) = 5.09 for dusty RSGs and log (L/L⊙) = 4.88 for non-dusty RSGs. In this work, we derive log (L/L⊙) = 5.01 from our sample of 20 dusty RSGs. We argue that the lower luminosity is a natural result of observing nearby galaxies and, as such, the ability to probe the lower end of the luminosity distribution. Each of these medians agrees with the conclusions of de Wit et al. (2024) that dusty RSGs are, as a population, more evolved than dust-free RSGs. If dusty RSGs are more evolved, they should also be more variable. Each RSG indicated in Fig. 5, showing a high degree of variability, also shows IR excess.
For those without Spitzer colors, for which we are unable to determine if they are dusty RSGs, and for those without dust, only one source was classified as a potential late M-type RSG (M2-M4 I:, ID: IC10-R17), whereas the other seven sources are either K or early M-types. This contrasts sharply with the sample of known dusty RSGs, which has nine late-type RSGs, around 40% of the sample. This can be explained as the TiO bands, which increase in strength with higher mass-loss rates, are used for classification. Higher mass-loss rates should, therefore, naturally lead to later-type classifications (Davies et al. 2013; Davies & Plez 2021).
5.3 Episodic mass loss
We relied on mid-IR indicators to detect massive evolved stars (Bonanos et al. 2009, 2010). In our southern survey (i.e., Bonanos et al. 2024), we discovered massive stars in transitional phases where eruptive or episodic mass loss occurs, such as luminous blue variable candidates (Maravelias et al. 2023). In this work, we report an emission line object (NGC 6822-106) that stands out as one of the brightest mid-IR sources in our sample and one of the faintest in the optical (Fig. 2). Its extreme G−[3.6] color (7.5 mag) closely resembles that of WOH G64 (G−[3.6] = 9.2 mag), the most extreme RSG in the Large Magellanic Cloud, which recently transitioned into a yellow hypergiant (Munoz-Sanchez et al. 2024b). NGC 6822-106 has a redder color than Var A (G − [3.6] = 5.0 mag), which is a yellow hypergiant from M33 that underwent an eruption for over 35 years (Hubble & Sandage 1953; Humphreys et al. 2006). The significant reddening and the strong Ca II triplet emission suggest that NGC 6822-106 is undergoing substantial mass loss, making it a compelling target for future studies. Its optical faintness prevented us from constructing a light curve and analyzing the potential eruption.
Several studies have reported spectral-type variations in RSGs (e.g., Levesque et al. 2007; Dorda et al. 2016) that are directly connected to changes in TiO strength. These variations can arise through different mechanisms. The rise and fall of convective cells at the stellar surface alter both the brightness and TiO absorption features of RSGs, creating hysteresis loops (Kravchenko et al. 2019, 2021). Episodic mass ejections can also significantly impact the spectral type and photometric variability (e.g., Massey et al. 2007; Humphreys et al. 2021; Dupree et al. 2022; Anugu et al. 2023; Munoz-Sanchez et al. 2024a). Consequently, long-term light curves are essential for identifying disruptive events associated with episodic mass loss and disentangling them from convection effects.
Two of our sources, IC10-5660 and IC10-9165, exhibit spectral variability between our two epochs. Both are luminous (log (L/L⊙) > 5.2), dusty RSGs that shifted from a late to an early M type over a span of two years. The Gaia variability of IC10-9165 prior to our observations, along with the higher extinction observed in the second epoch, suggest a mass ejection event near our first epoch. However, due to the lack of photometric coverage during our observations, we cannot confirm it. In contrast, IC10-5660 maintains constant brightness and extinction between epochs, making its spectral change more puzzling and without a clear cause.
We also classified four dusty RSGs as K-type supergiants: IC1613-28306, NGC 6822-55, IC10-5545, and IC10-26089. For the targets in IC 10, we investigated whether the high foreground extinction could explain their reddened Spitzer colors. Assuming a foreground extinction of AV = 4.3 mag (Schlafly & Finkbeiner 2011), we estimate that foreground dust contributes approximately [3.6]–[4.5] ~0.05 mag. After correcting for this factor, a significant IR excess remains, confirming these objects as genuinely dusty K-type RSGs. Following the recipe from Antoniadis et al. (2024, 2025), we estimated their mass-loss rate to be ![Mathematical equation: $\[\dot{M}<10^{-7} \mathrm{M}_{\odot} \mathrm{yr}^{-1}\]$](/articles/aa/full_html/2025/06/aa53571-24/aa53571-24-eq22.png) . These low rates imply an eruptive mass-loss mechanism is causing enhanced dust production (e.g., Beasor et al. 2020; Decin et al. 2024). Their light curves do not show strong variability, indicating that they are currently in a stable state. However, the mid-IR photometry was taken 20 years before our observations. Due to the absence of photometric coverage from that period, we can only speculate that a mass ejection event may have occurred back then. A possible explanation for the GK I supergiant IC1613-28306 is episodic mass loss during its approach to the Hayashi limit from the YSG phase (Cheng et al. 2024), forming dust around the supergiant.
. These low rates imply an eruptive mass-loss mechanism is causing enhanced dust production (e.g., Beasor et al. 2020; Decin et al. 2024). Their light curves do not show strong variability, indicating that they are currently in a stable state. However, the mid-IR photometry was taken 20 years before our observations. Due to the absence of photometric coverage from that period, we can only speculate that a mass ejection event may have occurred back then. A possible explanation for the GK I supergiant IC1613-28306 is episodic mass loss during its approach to the Hayashi limit from the YSG phase (Cheng et al. 2024), forming dust around the supergiant.
6 Summary
The ASSESS project (Bonanos et al. 2024) investigated the role of episodic mass loss in evolved massive stars. As part of this project, we have presented a new sample of observed, evolved massive stars from our northern survey, which contains three low-metallicity galaxies: NGC 6822, IC 10, and IC 1613. We collected the photometry of 163 observed targets, obtained their spectra through multi-object and long-slit spectroscopy using GTC-OSIRIS, and spectroscopically classified 124 of the 163 spectra (122 unique objects). The majority show an IR excess in their Spitzer photometry. Among these, we confirmed two SNR candidates and two H II regions and found thirty-three evolved massive stars: twenty-eight RSGs, two BSGs, one YSG, one Wolf–Rayet star, and one emission-line object. Remarkably, the Ca II triplet emission and the obscuration of the emission-line object suggest an ongoing period of enhanced mass loss. All but seven of the RSGs and the Wolf-Rayet star are newly discovered evolved massive stars. This work increases the sample of RSGs in IC 10 from 1 to 17.
We derived luminosities for 17 RSGs through SED fitting and the temperatures for 28 RSGs using the MARCS radiative transfer models, contributing significantly to our knowledge of the known low-metallicity RSGs in northern galaxies. The properties of the dusty RSGs agree well with those determined by de Wit et al. (2024), with a median temperature of 3530 K and a median luminosity of log (L/L⊙) = 5.01. The optical spectra of two of the RSGs varied over two years, changing by a few spectral types. In particular, we find more extinction in the second epoch of IC10-9165, which suggests an episodic mass loss event. Lastly, we find four K-type RSGs with IR excess, reinforcing previous results by de Wit et al. (2024). We speculate that these four RSGs experienced episodic mass loss, leading to excessive dust formation and giving rise to the IR excess we observe.
Future studies can utilize photometry to optimize the process of finding and characterizing RSGs, specifically those with high mass loss that is potentially episodic. Using large surveys like ZTF, LSST, and NEOWISE, machine-learning algorithms such as those presented by Maravelias et al. (2022, 2025) can automatically predict the general spectral classes of the sources based on their colors and photometric variability. A combination of such algorithms can be used in low-risk, systematic large-scale studies of RSG populations in a variety of metallicity environments. Mapping the luminosities and temperatures of RSG populations can lead to the determination of the luminosity functions of RSGs in galaxies, providing an indirect measurement of a time-averaged mass-loss rate of the RSG phase (Massey et al. 2023; Zapartas et al. 2025).
Data availability
The full Table 3 is available at the CDS via anonymous ftp to cdsarc.cds.unistra.fr (130.79.128.5) or via https://cdsarc.cds.unistra.fr/viz-bin/cat/J/A+A/698/A279
Acknowledgements
The authors acknowledge funding support from the European Research Council (ERC) under the European Union’s Horizon 2020 research and innovation program (ASSESS; Grant agreement No. 772086). We thank Emmanouil Zapartas and the POSYDON team for providing POSYDON evolutionary tracks prior to publication. Based on observations made with the Gran Telescopio Canarias (GTC), installed at the Spanish Observatorio del Roque de los Muchachos of the Instituto de Astrofísica de Canarias, on the island of La Palma. This work is based on data obtained with the instrument OSIRIS, built by a Consortium led by the Instituto de Astrofísica de Canarias in collaboration with the Instituto de Astronomía of the Universidad Autónoma de México. OSIRIS was funded by GRANTECAN and the National Plan of Astronomy and Astrophysics of the Spanish Government. The Digitized Sky Surveys were produced at the Space Telescope Science Institute under U.S. Government grant NAG W-2166. The images of these surveys are based on photographic data obtained using the Oschin Schmidt Telescope on Palomar Mountain and the UK Schmidt Telescope. The plates were processed into the present compressed digital form with the permission of these institutions. This research made use of Astropy, a community-developed core Python package for Astronomy (Astropy Collaboration 2013, 2018) and Photutils, an Astropy package for the detection and photometry of astronomical sources (Bradley et al. 2022). "This research has made use of the VizieR catalogue access tool, CDS, Strasbourg, France (10.26093/cds/vizier). The original description of the VizieR service was published in Ochsenbein et al. (2000).
Appendix A Observation data
Distribution of targets and target priorities per galaxy.
OSIRIS observations.
Appendix B Example spectra for highlighted classes
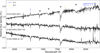 |
Fig. B.1 Similar to Fig. 3, but for two BSGs and one YSG. The oxygen triplet, Hα, and the Paschen series are identified. |
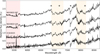 |
Fig. B.2 Similar to Fig. 3, but for carbon stars. Regions of significant carbon absorption are identified in orange (CN) and red (C2; for NGC 6822-387 and NGC 6822-170). |
Appendix C SED fits
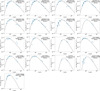 |
Fig. C.1 Black bodies fitted to the photometry from Gaia, Pan-STARRS1, VISTA, ZTF, and Spitzer. The target name, derived luminosity, and spectral type are indicated in each panel. |
Appendix D Light curves
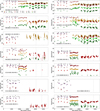 |
Fig. D.1 Multi-survey optical light curve of the RSGs. Apparent magnitudes from Pan-STARRS1 DR2 (triangles: gri), Gaia DR3 (circles: G, BP, RP), ZTF (upper triangles: g, r), and ATLAS (diamonds: c, o) are shown. The vertical dashed line indicates the epoch of the OSIRIS spectroscopy. |
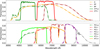 |
Fig. D.2 Transmission of the photometric filters used for the light curves. |
Appendix E Spectra and fitted models
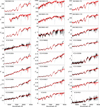 |
Fig. E.1 Best-fit MARCS models (red) to all spectra of RSGs (black). Gray regions are excluded from the fit due to contamination by telluric absorption. Fλ is in units of 10−18 erg cm−2 s−1 A−1. |
References
- Andrews, J. J., Bavera, S. S., Briel, M., et al. 2024, AAS J., submitted, [arXiv:2411.02376] [Google Scholar]
- Antoniadis, K., Bonanos, A. Z., de Wit, S., et al. 2024, A&A, 686, A88 [NASA ADS] [CrossRef] [EDP Sciences] [Google Scholar]
- Antoniadis, K., Zapartas, E., Bonanos, A. Z., et al. 2025, A&A, submitted [arXiv:2503.05876] [Google Scholar]
- Anugu, N., Baron, F., Gies, D. R., et al. 2023, AJ, 166, 78 [NASA ADS] [CrossRef] [Google Scholar]
- Arroyo-Torres, B., Wittkowski, M., Chiavassa, A., et al. 2015, A&A, 575, A50 [NASA ADS] [CrossRef] [EDP Sciences] [Google Scholar]
- Astropy Collaboration (Robitaille, T. P., et al.) 2013, A&A, 558, A33 [NASA ADS] [CrossRef] [EDP Sciences] [Google Scholar]
- Astropy Collaboration (Price-Whelan, A. M., et al.) 2018, AJ, 156, 123 [Google Scholar]
- Beasor, E. R., & Smith, N. 2022, ApJ, 933, 41 [NASA ADS] [CrossRef] [Google Scholar]
- Beasor, E. R., Davies, B., Smith, N., et al. 2020, MNRAS, 492, 5994 [Google Scholar]
- Bellm, E. C., Kulkarni, S. R., Graham, M. J., et al. 2019, PASP, 131, 018002 [Google Scholar]
- Bergemann, M., Hoppe, R., Semenova, E., et al. 2021, MNRAS, 508, 2236 [NASA ADS] [CrossRef] [Google Scholar]
- Bonanos, A. Z., Massa, D. L., Sewilo, M., et al. 2009, AJ, 138, 1003 [Google Scholar]
- Bonanos, A. Z., Lennon, D. J., Köhlinger, F., et al. 2010, AJ, 140, 416 [NASA ADS] [CrossRef] [Google Scholar]
- Bonanos, A. Z., Tramper, F., de Wit, S., et al. 2024, A&A, 686, A77 [NASA ADS] [CrossRef] [EDP Sciences] [Google Scholar]
- Boyer, M. L., McQuinn, K. B. W., Barmby, P., et al. 2015, ApJS, 216, 10 [Google Scholar]
- Bradley, L., Sipőcz, B., Robitaille, T., et al. 2022, astropy/photutils: 1.5.0 [Google Scholar]
- Brands, S. A., de Koter, A., Bestenlehner, J. M., et al. 2023, A&A, 673, A132 [NASA ADS] [CrossRef] [EDP Sciences] [Google Scholar]
- Bresolin, F., Urbaneja, M. A., Gieren, W., Pietrzyński, G., & Kudritzki, R.-P. 2007, ApJ, 671, 2028 [NASA ADS] [CrossRef] [Google Scholar]
- Britavskiy, N. E., Bonanos, A. Z., Mehner, A., et al. 2015, A&A, 584, A33 [NASA ADS] [CrossRef] [EDP Sciences] [Google Scholar]
- Britavskiy, N. E., Bonanos, A. Z., Herrero, A., et al. 2019, A&A, 631, A95 [NASA ADS] [CrossRef] [EDP Sciences] [Google Scholar]
- Buchner, J. 2021, J. Open Source Softw., 6, 3001 [CrossRef] [Google Scholar]
- Castor, J. I., Abbott, D. C., & Klein, R. I. 1975, ApJ, 195, 157 [Google Scholar]
- Cepa, J., Aguiar, M., Escalera, V. G., et al. 2000, SPIE Conf. Ser., 4008, 623 [Google Scholar]
- Cepa, J., Aguiar-Gonzalez, M., Bland-Hawthorn, J., et al. 2003, SPIE Conf. Ser., 4841, 1739 [NASA ADS] [Google Scholar]
- Chambers, K. C., Magnier, E. A., Metcalfe, N., et al. 2016, arXiv e-prints [arXiv:1612.05560] [Google Scholar]
- Cheng, S. J., Goldberg, J. A., Cantiello, M., et al. 2024, ApJ, 974, 270 [NASA ADS] [CrossRef] [Google Scholar]
- Christodoulou, E., de Wit, S., Bonanos, A. Z., et al. 2025, A&A, submitted [Google Scholar]
- Chun, S.-H., Yoon, S.-C., Oh, H., Park, B.-G., & Hwang, N. 2022, ApJ, 939, 28 [NASA ADS] [CrossRef] [Google Scholar]
- Cohen, D. H., Wollman, E. E., Leutenegger, M. A., et al. 2014, MNRAS, 439, 908 [NASA ADS] [CrossRef] [Google Scholar]
- Cosens, M., Wright, S. A., Sandstrom, K., et al. 2024, AJ, 168, 250 [Google Scholar]
- Crowther, P. A., Drissen, L., Abbott, J. B., Royer, P., & Smartt, S. J. 2003, A&A, 404, 483 [NASA ADS] [CrossRef] [EDP Sciences] [Google Scholar]
- Davies, B., & Plez, B. 2021, MNRAS, 508, 5757 [NASA ADS] [CrossRef] [Google Scholar]
- Davies, B., Kudritzki, R.-P., Plez, B., et al. 2013, ApJ, 767, 3 [Google Scholar]
- Davies, B., Crowther, P. A., & Beasor, E. R. 2018, MNRAS, 478, 3138 [NASA ADS] [CrossRef] [Google Scholar]
- de Jager, C., Nieuwenhuijzen, H., & van der Hucht, K. A. 1988, A&AS, 72, 259 [NASA ADS] [Google Scholar]
- de Wit, S., Bonanos, A. Z., Tramper, F., et al. 2023, A&A, 669, A86 [NASA ADS] [CrossRef] [EDP Sciences] [Google Scholar]
- de Wit, S., Bonanos, A. Z., Antoniadis, K., et al. 2024, A&A, 689, A46 [NASA ADS] [CrossRef] [EDP Sciences] [Google Scholar]
- Decin, L., Richards, A. M. S., Marchant, P., & Sana, H. 2024, A&A, 681, A17 [NASA ADS] [CrossRef] [EDP Sciences] [Google Scholar]
- Dorda, R., González-Fernández, C., & Negueruela, I. 2016, A&A, 595, A105 [NASA ADS] [CrossRef] [EDP Sciences] [Google Scholar]
- Drevon, J., Millour, F., Cruzalèbes, P., et al. 2024, MNRAS, 527, L88 [Google Scholar]
- Dupree, A. K., Strassmeier, K. G., Calderwood, T., et al. 2022, ApJ, 936, 18 [NASA ADS] [CrossRef] [Google Scholar]
- Dye, S., Lawrence, A., Read, M. A., et al. 2018, MNRAS, 473, 5113 [Google Scholar]
- Elias, J. H., Frogel, J. A., & Humphreys, R. M. 1985, ApJS, 57, 91 [NASA ADS] [CrossRef] [Google Scholar]
- Fazio, G. G., Hora, J. L., Allen, L. E., et al. 2004, ApJS, 154, 10 [Google Scholar]
- Förster, F., Moriya, T. J., Maureira, J. C., et al. 2018, Nat. Astron., 2, 808 [CrossRef] [Google Scholar]
- Fragos, T., Andrews, J. J., Bavera, S. S., et al. 2023, ApJS, 264, 45 [NASA ADS] [CrossRef] [Google Scholar]
- Fullerton, A. W., Massa, D. L., & Prinja, R. K. 2006, ApJ, 637, 1025 [Google Scholar]
- Gaia Collaboration (Prusti, T., et al.) 2016, A&A, 595, A1 [NASA ADS] [CrossRef] [EDP Sciences] [Google Scholar]
- Gaia Collaboration (Brown, A. G. A., et al.) 2018, A&A, 616, A1 [NASA ADS] [CrossRef] [EDP Sciences] [Google Scholar]
- Gaia Collaboration (Vallenari, A., et al.) 2023, A&A, 674, A1 [NASA ADS] [CrossRef] [EDP Sciences] [Google Scholar]
- Gal-Yam, A. 2012, Science, 337, 927 [Google Scholar]
- Gal-Yam, A. 2019, ARA&A, 57, 305 [Google Scholar]
- Górski, M., Pietrzyński, G., & Gieren, W. 2011, AJ, 141, 194 [Google Scholar]
- Groenewegen, M. A. T., & Sloan, G. C. 2018, A&A, 609, A114 [NASA ADS] [CrossRef] [EDP Sciences] [Google Scholar]
- Gustafsson, B., Edvardsson, B., Eriksson, K., et al. 2008, A&A, 486, 951 [NASA ADS] [CrossRef] [EDP Sciences] [Google Scholar]
- Gvaramadze, V. V., Kniazev, A. Y., & Fabrika, S. 2010, MNRAS, 405, 1047 [NASA ADS] [Google Scholar]
- Gómez-González, V. M. A., Mayya, Y. D., & Rosa-González, D. 2016, MNRAS, 460, 1555 [Google Scholar]
- Hubble, E., & Sandage, A. 1953, ApJ, 118, 353 [Google Scholar]
- Hubble, E. P. 1925, ApJ, 62, 409 [NASA ADS] [CrossRef] [Google Scholar]
- Humphreys, R. M., Jones, T. J., Polomski, E., et al. 2006, AJ, 131, 2105 [Google Scholar]
- Humphreys, R. M., Davidson, K., Richards, A. M. S., et al. 2021, AJ, 161, 98 [NASA ADS] [CrossRef] [Google Scholar]
- Humphreys, R. M., Jones, T. J., & Martin, J. C. 2023, AJ, 166, 50 [NASA ADS] [CrossRef] [Google Scholar]
- Irwin, M. J. 2013, in Astrophysics and Space Science Proceedings, 37, Thirty Years of Astronomical Discovery with UKIRT, 229 [Google Scholar]
- Josselin, E., & Plez, B. 2007, A&A, 469, 671 [NASA ADS] [CrossRef] [EDP Sciences] [Google Scholar]
- Kacharov, N., Rejkuba, M., & Cioni, M. R. L. 2012, A&A, 537, A108 [NASA ADS] [CrossRef] [EDP Sciences] [Google Scholar]
- Kee, N. D., Sundqvist, J. O., Decin, L., de Koter, A., & Sana, H. 2021, A&A, 646, A180 [NASA ADS] [CrossRef] [EDP Sciences] [Google Scholar]
- Khan, R., Stanek, K. Z., Kochanek, C. S., & Sonneborn, G. 2015, ApJS, 219, 42 [NASA ADS] [CrossRef] [Google Scholar]
- Kinman, T. D., Green, J. R., & Mahaffey, C. T. 1979, PASP, 91, 749 [Google Scholar]
- Kopsacheili, M., Zezas, A., & Leonidaki, I. 2020, MNRAS, 491, 889 [CrossRef] [Google Scholar]
- Koumpia, E., Oudmaijer, R. D., Graham, V., et al. 2020, A&A, 635, A183 [NASA ADS] [CrossRef] [EDP Sciences] [Google Scholar]
- Kravchenko, K., Chiavassa, A., Van Eck, S., et al. 2019, A&A, 632, A28 [NASA ADS] [CrossRef] [EDP Sciences] [Google Scholar]
- Kravchenko, K., Jorissen, A., Van Eck, S., et al. 2021, A&A, 650, L17 [NASA ADS] [CrossRef] [EDP Sciences] [Google Scholar]
- Lee, H., Grebel, E. K., & Hodge, P. W. 2003, A&A, 401, 141 [NASA ADS] [CrossRef] [EDP Sciences] [Google Scholar]
- Levesque, E. M., & Massey, P. 2012, AJ, 144, 2 [CrossRef] [Google Scholar]
- Levesque, E. M., Massey, P., Olsen, K. A. G., & Plez, B. 2007, ApJ, 667, 202 [NASA ADS] [CrossRef] [Google Scholar]
- Levesque, E. M., Massey, P., Plez, B., & Olsen, K. A. G. 2009, AJ, 137, 4744 [NASA ADS] [CrossRef] [Google Scholar]
- Ma, J.-Z., Chiavassa, A., de Mink, S. E., et al. 2024, ApJ, 962, L36 [NASA ADS] [CrossRef] [Google Scholar]
- Maíz Apellániz, J., Evans, C. J., Barbá, R. H., et al. 2014, A&A, 564, A63 [CrossRef] [EDP Sciences] [Google Scholar]
- Maravelias, G., Bonanos, A. Z., Tramper, F., et al. 2022, A&A, 666, A122 [NASA ADS] [CrossRef] [EDP Sciences] [Google Scholar]
- Maravelias, G., de Wit, S., Bonanos, A. Z., et al. 2023, Galaxies, 11, 79 [NASA ADS] [CrossRef] [Google Scholar]
- Maravelias, G., Bonanos, A. Z., Antoniadis, K., et al. 2025, A&A, submitted, [arXiv:2504.01232] [Google Scholar]
- Massey, P. 1998, ApJ, 501, 153 [Google Scholar]
- Massey, P., McNeill, R. T., Olsen, K. A. G., et al. 2007, AJ, 134, 2474 [NASA ADS] [CrossRef] [Google Scholar]
- Massey, P., Plez, B., Levesque, E. M., et al. 2005, ApJ, 634, 1286 [NASA ADS] [CrossRef] [Google Scholar]
- Mauerhan, J. C., Smith, N., Filippenko, A. V., et al. 2013, MNRAS, 430, 1801 [NASA ADS] [CrossRef] [Google Scholar]
- Massey, P., Neugent, K. F., Ekström, S., et al. 2023, ApJ, 942, 69 [NASA ADS] [CrossRef] [Google Scholar]
- McDonald, S. L. E., Davies, B., & Beasor, E. R. 2022, MNRAS, 510, 3132 [NASA ADS] [CrossRef] [Google Scholar]
- McMahon, R. 2012, in Science from the Next Generation Imaging and Spectroscopic Surveys, 37 [Google Scholar]
- McQuinn, K. B. W., Boyer, M. L., Mitchell, M. B., et al. 2017, ApJ, 834, 78 [Google Scholar]
- Montargès, M., Cannon, E., Lagadec, E., et al. 2021, Nature, 594, 365 [Google Scholar]
- Moustakas, J., Kennicutt, Robert C., J., Tremonti, C. A., et al. 2010, ApJS, 190, 233 [NASA ADS] [CrossRef] [Google Scholar]
- Munoz-Sanchez, G., de Wit, S., Bonanos, A. Z., et al. 2024a, A&A, 690, A99 [NASA ADS] [CrossRef] [EDP Sciences] [Google Scholar]
- Munoz-Sanchez, G., Kalitsounaki, M., de Wit, S., et al. 2024b, Nat. Astron., submitted, [arXiv:2411.19329] [Google Scholar]
- Neill, J. D., Sullivan, M., Gal-Yam, A., et al. 2011, ApJ, 727, 15 [NASA ADS] [CrossRef] [Google Scholar]
- Ochsenbein, F., Bauer, P., & Marcout, J. 2000, A&AS, 143, 23 [NASA ADS] [CrossRef] [EDP Sciences] [Google Scholar]
- Ohnaka, K., Driebe, T., Hofmann, K. H., et al. 2008, A&A, 484, 371 [NASA ADS] [CrossRef] [EDP Sciences] [Google Scholar]
- Patrick, L. R., Evans, C. J., Davies, B., et al. 2015, ApJ, 803, 14 [Google Scholar]
- Polles, F. L., Madden, S. C., Lebouteiller, V., et al. 2019, A&A, 622, A119 [NASA ADS] [CrossRef] [EDP Sciences] [Google Scholar]
- Rieke, G. H., Young, E. T., Engelbracht, C. W., et al. 2004, ApJS, 154, 25 [Google Scholar]
- Rubin, R. H., Simpson, J. P., Colgan, S. W. J., et al. 2016, MNRAS, 459, 1875 [Google Scholar]
- Schlafly, E. F., & Finkbeiner, D. P. 2011, ApJ, 737, 103 [Google Scholar]
- Skilling, J. 2004, in Bayesian Inference and Maximum Entropy Methods in Science and Engineering: 24th International Workshop on Bayesian Inference and Maximum Entropy Methods in Science and Engineering, eds. R. Fischer, R. Preuss, & U. V. Toussaint, American Institute of Physics Conference Series, 735, 395 [NASA ADS] [Google Scholar]
- Smartt, S. J. 2015, PASA, 32, e016 [NASA ADS] [CrossRef] [Google Scholar]
- Smartt, S. J., Eldridge, J. J., Crockett, R. M., & Maund, J. R. 2009, MNRAS, 395, 1409 [CrossRef] [Google Scholar]
- Smith, N. 2014, ARA&A, 52, 487 [NASA ADS] [CrossRef] [Google Scholar]
- Smith, N., Andrews, J. E., Filippenko, A. V., et al. 2022, MNRAS, 515, 71 [NASA ADS] [CrossRef] [Google Scholar]
- Solf, J. 1978, A&AS, 34, 409 [Google Scholar]
- Sukhbold, T., Ertl, T., Woosley, S. E., Brown, J. M., & Janka, H. T. 2016, ApJ, 821, 38 [NASA ADS] [CrossRef] [Google Scholar]
- Telford, O. G., Chisholm, J., Sander, A. A. C., et al. 2024, ApJ, 974, 85 [NASA ADS] [Google Scholar]
- Tikhonov, N. A., & Galazutdinova, O. A. 2009, Astron. Lett., 35, 748 [Google Scholar]
- Tonry, J. L., Denneau, L., Heinze, A. N., et al. 2018, PASP, 130, 064505 [Google Scholar]
- Tully, R. B., Courtois, H. M., Dolphin, A. E., et al. 2013, AJ, 146, 86 [NASA ADS] [CrossRef] [Google Scholar]
- van Loon, J. T., Cioni, M. R. L., Zijlstra, A. A., & Loup, C. 2005, A&A, 438, 273 [NASA ADS] [CrossRef] [EDP Sciences] [Google Scholar]
- Vink, J. S., & Sander, A. A. C. 2021, MNRAS, 504, 2051 [NASA ADS] [CrossRef] [Google Scholar]
- Vink, J. S., de Koter, A., & Lamers, H. J. G. L. M. 2000, A&A, 362, 295 [Google Scholar]
- Vink, J. S., de Koter, A., & Lamers, H. J. G. L. M. 2001, A&A, 369, 574 [NASA ADS] [CrossRef] [EDP Sciences] [Google Scholar]
- Yang, H., & Skillman, E. D. 1993, AJ, 106, 1448 [NASA ADS] [CrossRef] [Google Scholar]
- Yang, M., Bonanos, A. Z., Jiang, B.-W., et al. 2018, A&A, 616, A175 [NASA ADS] [CrossRef] [EDP Sciences] [Google Scholar]
- Yang, M., Bonanos, A. Z., Jiang, B., et al. 2023, A&A, 676, A84 [NASA ADS] [CrossRef] [EDP Sciences] [Google Scholar]
- Yoon, S.-C., & Cantiello, M. 2010, ApJ, 717, L62 [NASA ADS] [CrossRef] [Google Scholar]
- Zapartas, E., de Wit, S., Antoniadis, K., et al. 2025, A&A, 697, A167 [NASA ADS] [CrossRef] [EDP Sciences] [Google Scholar]
- Zgirski, B., Pietrzyński, G., Gieren, W., et al. 2021, ApJ, 916, 19 [NASA ADS] [CrossRef] [Google Scholar]
IRAF is distributed by the National Optical Astronomy Observatory, operated by the Association of Universities for Research in Astronomy (AURA) under agreement with the National Science Foundation.
For observations taken in 2020, while the 2022 upgrade implemented a monolithic CCD.
All Tables
All Figures
|
Fig. 1 Spatial distribution of classified sources in NGC 6822 (left) and IC 10 (right); background images are from DSS2-red. |
| In the text | |
|
Fig. 2 Near-IR and optical color-magnitude diagrams of classified sources. We show the locations of classified targets with Spitzer IRAC photometry for NGC 6822 (top left) and IC 10 (top right) and with Gaia photometry for NGC 6822 (bottom left) and IC 10 (bottom right). The dashed lines indicate the priority criteria from Bonanos et al. (2024). IC10-52406 is the only RSG that shows no IR excess, as it was a serendipitous observation. |
| In the text | |
|
Fig. 3 OSIRIS spectra of classified RSGs. We show four RSGs with increasing TiO absorption strengths, which highlights the spectral type sequence of RSGs. Purple-shaded areas indicate regions with TiO absorption. A ⊕ marks telluric absorption. |
| In the text | |
|
Fig. 4 Multi-survey optical light curve of NGC 6822-52. Apparent magnitudes from Pan-STARRS1 DR2 (triangles: gri), Gaia DR3 (circles: G, BP, RP), ZTF (upper triangles: g, r), and ATLAS (diamonds: c, o) are shown. The vertical dashed line indicates the epoch of the OSIRIS spectroscopy. |
| In the text | |
|
Fig. 5 MAD vs. magnitude diagram of RSGs in the ZTF–r (top), ATLAS-o (middle), and Gaia-G (bottom) bands. Variable RSGs with firm classifications are labeled. |
| In the text | |
|
Fig. 6 MARCS model (red) fitted to the spectrum of NGC 6822-66 (black). Gray regions are excluded from the fit due to contamination by telluric absorption. Fλ is in units of 10−18 erg cm−2 s−1 A−1. Top: overall OSIRIS spectrum. Bottom: zoom in on the Ca II triplet. |
| In the text | |
|
Fig. 7 Radius vs. luminosity of the RSGs in the sample. Gray sources are from the ASSESS southern sample (de Wit et al. 2024). The color indicates the effective temperature. The extreme WOH G64 in its RSG state is shown as a reference. |
| In the text | |
|
Fig. 8 HR diagram of RSGs in NGC 6822, IC 10, and IC 1613 compared to RSGs in NGC 55 (de Wit et al. 2024). Four Posydon evolutionary tracks for Z/Z⊙ = 0.2 are overplotted; the color indicates the central helium abundance, while dots indicate intervals of 10,000 yr. Each panel includes effective temperatures determined using the following methods: TiO-band fits (top), the i-band scaling relation applied to our TiO temperatures (middle), and the J-band scaling relation (bottom). |
| In the text | |
|
Fig. B.1 Similar to Fig. 3, but for two BSGs and one YSG. The oxygen triplet, Hα, and the Paschen series are identified. |
| In the text | |
|
Fig. B.2 Similar to Fig. 3, but for carbon stars. Regions of significant carbon absorption are identified in orange (CN) and red (C2; for NGC 6822-387 and NGC 6822-170). |
| In the text | |
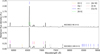 |
Fig. B.3 Similar to Fig. 3, but for the H II regions. Primary emission lines are identified. |
| In the text | |
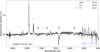 |
Fig. B.4 Similar to Fig. 3, but for the emission line object. Primary emission lines are identified. |
| In the text | |
|
Fig. C.1 Black bodies fitted to the photometry from Gaia, Pan-STARRS1, VISTA, ZTF, and Spitzer. The target name, derived luminosity, and spectral type are indicated in each panel. |
| In the text | |
|
Fig. D.1 Multi-survey optical light curve of the RSGs. Apparent magnitudes from Pan-STARRS1 DR2 (triangles: gri), Gaia DR3 (circles: G, BP, RP), ZTF (upper triangles: g, r), and ATLAS (diamonds: c, o) are shown. The vertical dashed line indicates the epoch of the OSIRIS spectroscopy. |
| In the text | |
|
Fig. D.2 Transmission of the photometric filters used for the light curves. |
| In the text | |
|
Fig. E.1 Best-fit MARCS models (red) to all spectra of RSGs (black). Gray regions are excluded from the fit due to contamination by telluric absorption. Fλ is in units of 10−18 erg cm−2 s−1 A−1. |
| In the text | |
Current usage metrics show cumulative count of Article Views (full-text article views including HTML views, PDF and ePub downloads, according to the available data) and Abstracts Views on Vision4Press platform.
Data correspond to usage on the plateform after 2015. The current usage metrics is available 48-96 hours after online publication and is updated daily on week days.
Initial download of the metrics may take a while.