Fig. 8
Download original image
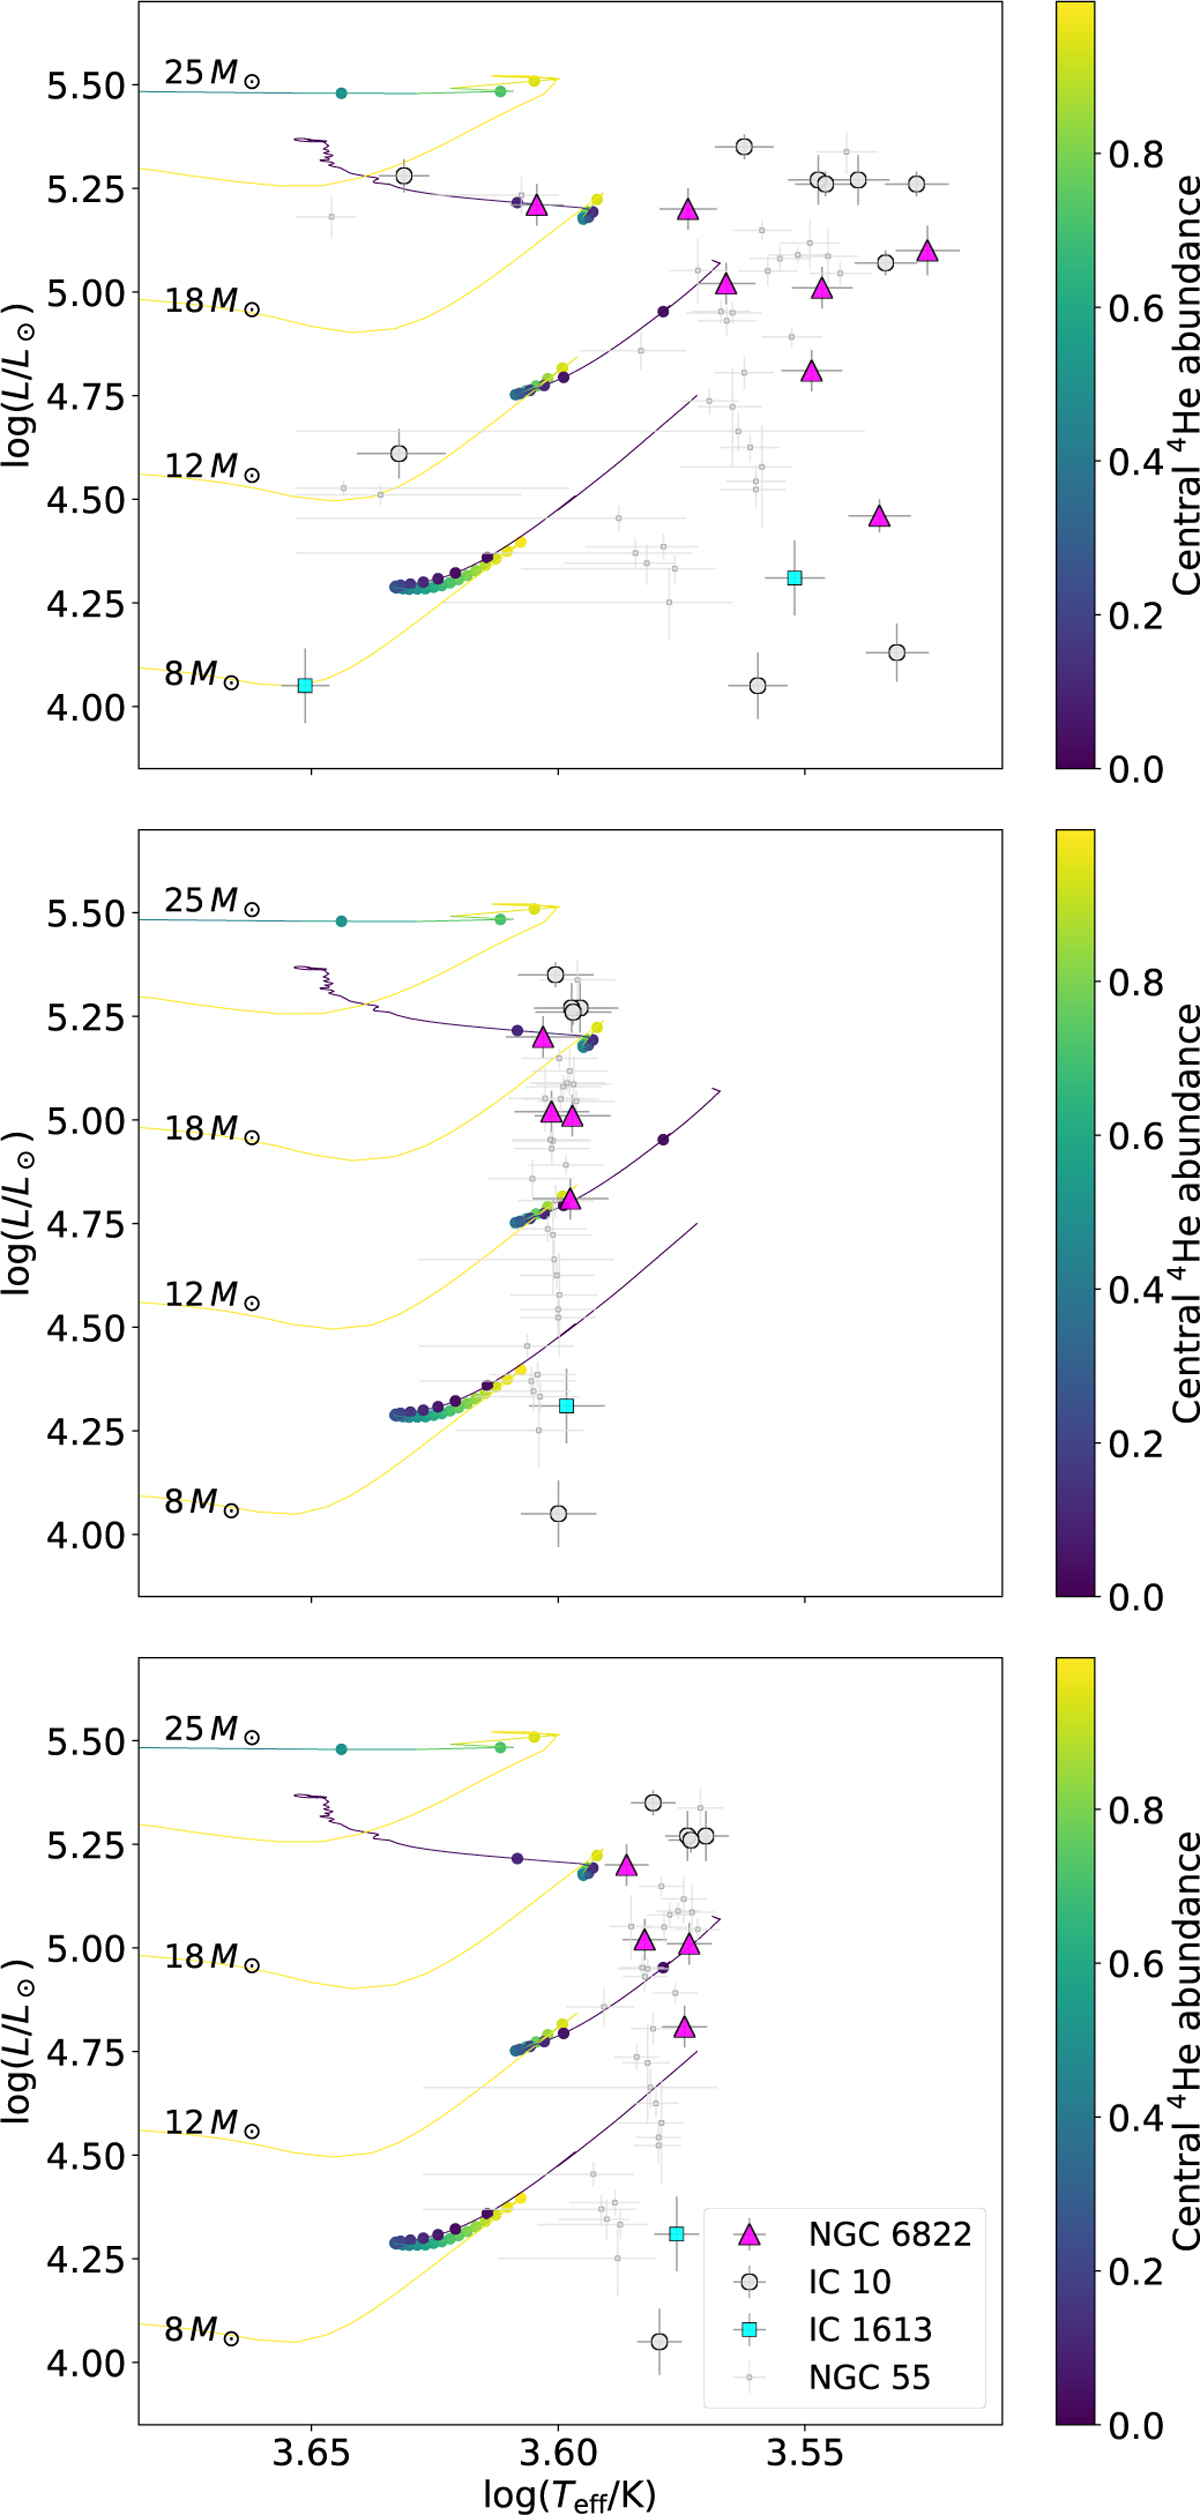
HR diagram of RSGs in NGC 6822, IC 10, and IC 1613 compared to RSGs in NGC 55 (de Wit et al. 2024). Four Posydon evolutionary tracks for Z/Z⊙ = 0.2 are overplotted; the color indicates the central helium abundance, while dots indicate intervals of 10,000 yr. Each panel includes effective temperatures determined using the following methods: TiO-band fits (top), the i-band scaling relation applied to our TiO temperatures (middle), and the J-band scaling relation (bottom).
Current usage metrics show cumulative count of Article Views (full-text article views including HTML views, PDF and ePub downloads, according to the available data) and Abstracts Views on Vision4Press platform.
Data correspond to usage on the plateform after 2015. The current usage metrics is available 48-96 hours after online publication and is updated daily on week days.
Initial download of the metrics may take a while.