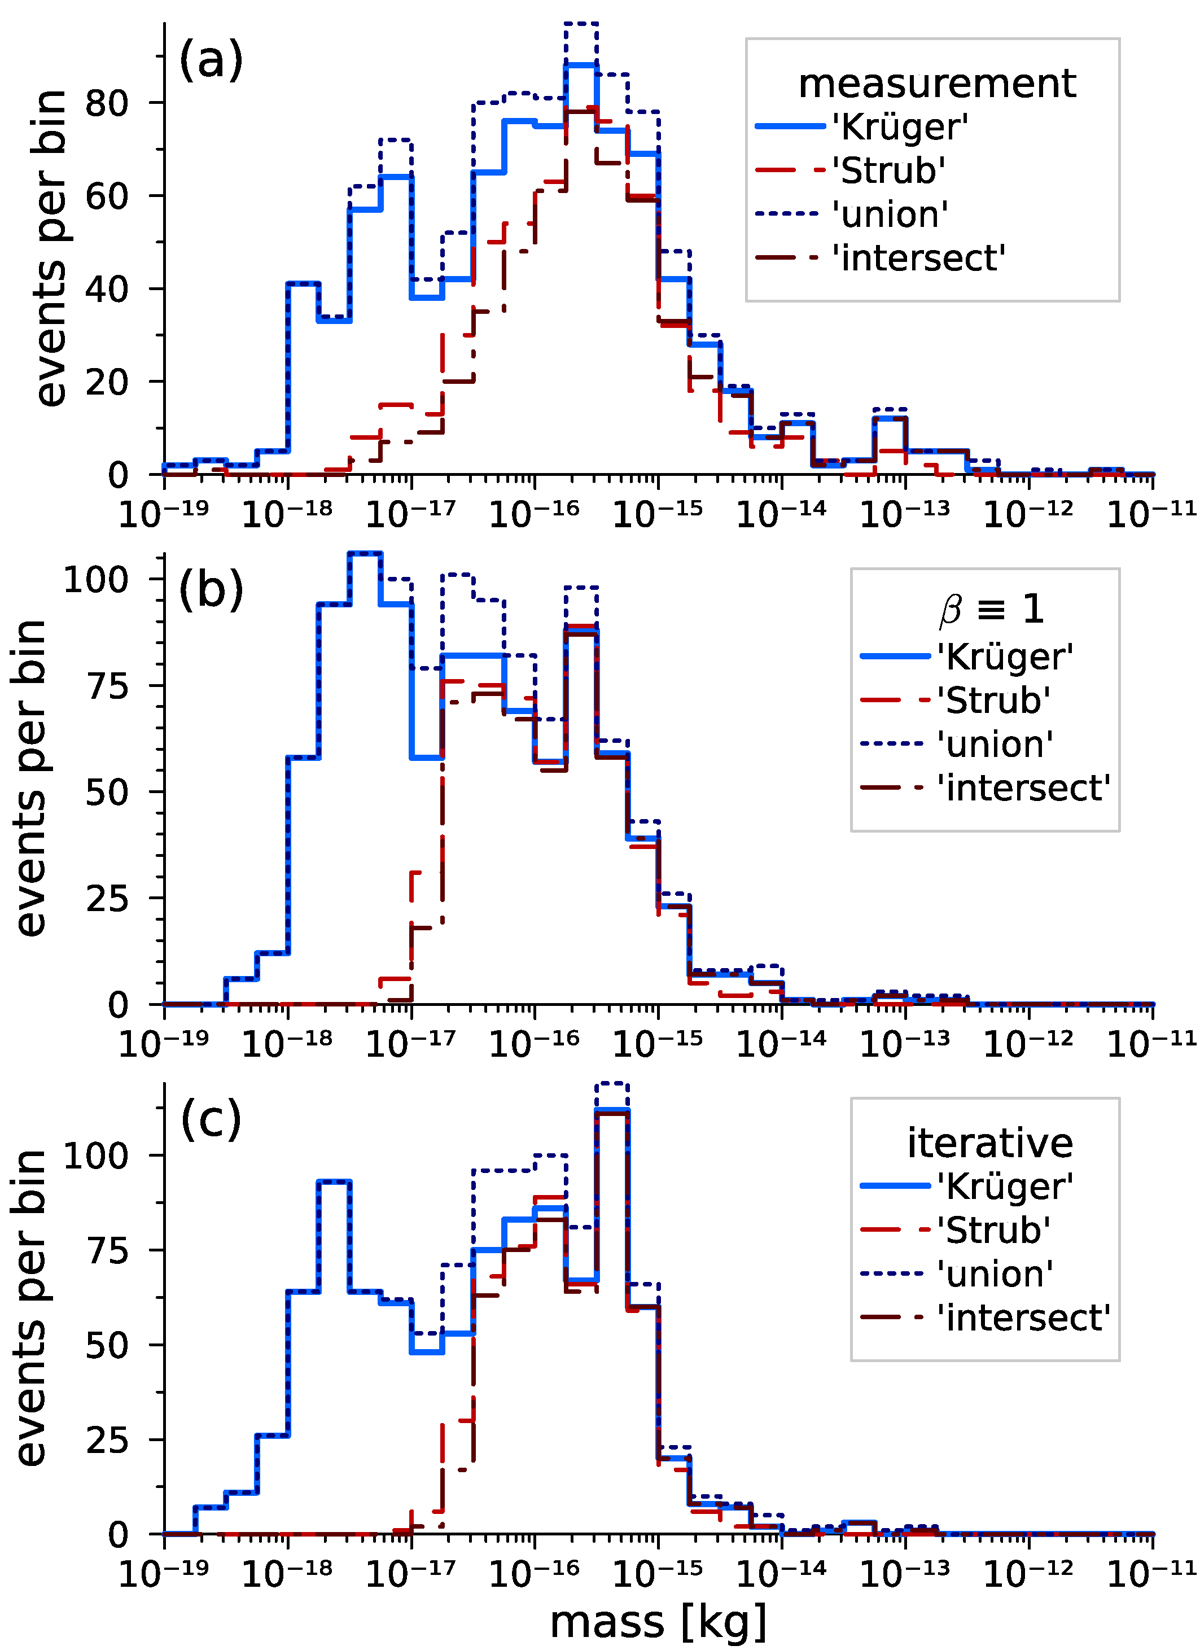
Fig. 8.
Download original image
Mass distribution of the Krüger (thick solid blue line), Strub (dashed red line), union (dotted indigo line), and intersect (dash-dotted maroon line) subsets for the masses derived from measurements (panel a; cf. Sect. 4.1), approximated with β ≡ 1 (panel b; cf. Sect. 4.2), and calculated iteratively (panel c; cf. Sect. 4.3) with an assumed density of ρd = 2500 kg/m3. Measurement-derived masses corresponding to vmsr < 3 km/s were not taken into account (cf. Sect. 4.1). (See Krüger et al. 2015, Fig. 5, and Janisch 2021, Fig. 5.32.)
Current usage metrics show cumulative count of Article Views (full-text article views including HTML views, PDF and ePub downloads, according to the available data) and Abstracts Views on Vision4Press platform.
Data correspond to usage on the plateform after 2015. The current usage metrics is available 48-96 hours after online publication and is updated daily on week days.
Initial download of the metrics may take a while.