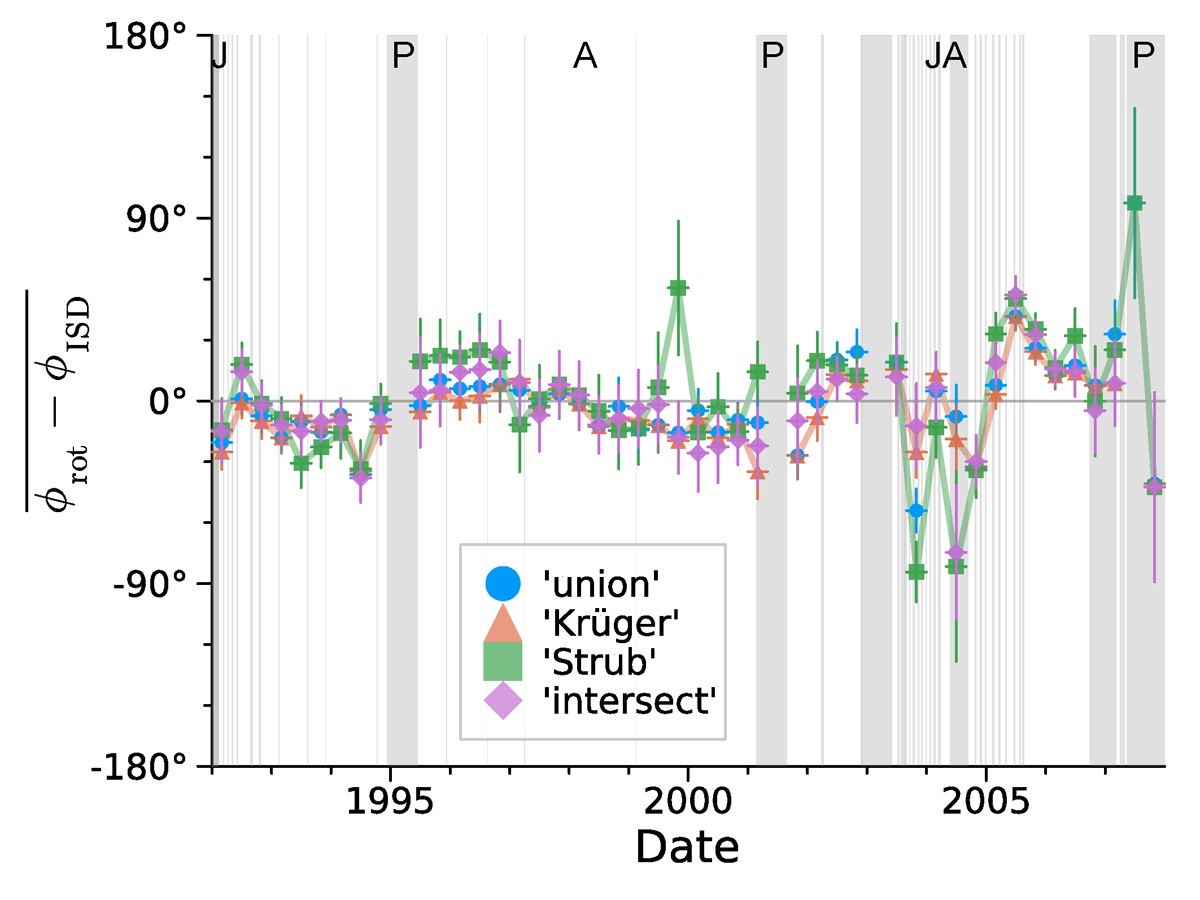
Fig. 6.
Download original image
Mean deviation of each events’ rotation angle, ϕrot, from the rotation angle corresponding to the ISD inflow vector, ϕISD, for the union (blue circles), the Krüger (orange triangles), the Strub (green squares), and the intersect (violet diamonds) subsets, averaged over Δt = 4 months beginning on 1 January 1992. Horizontal error bars denote the width of the time bin, and vertical error bars were calculated with Eq. (B.10), taking into account wall impacts (cf. Fig. B.1). Grey-shaded areas and letters at the top edge are as in Fig. 5. (After Janisch 2021, Fig. 5.17.)
Current usage metrics show cumulative count of Article Views (full-text article views including HTML views, PDF and ePub downloads, according to the available data) and Abstracts Views on Vision4Press platform.
Data correspond to usage on the plateform after 2015. The current usage metrics is available 48-96 hours after online publication and is updated daily on week days.
Initial download of the metrics may take a while.