Fig. 5.
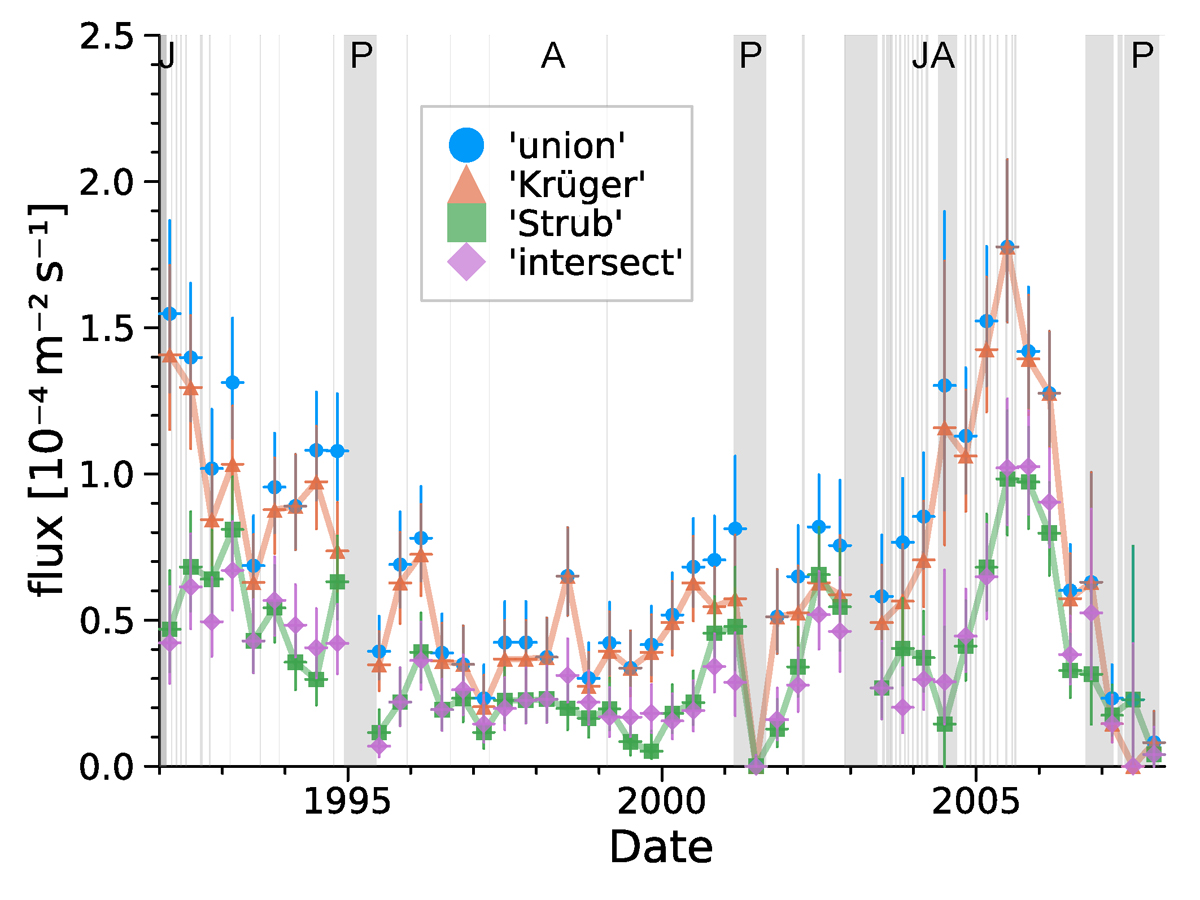
Download original image
Interstellar dust particle flux for the union (blue circles), Krüger (orange triangles), Strub (green squares), and intersect (violet diamonds) subsets. The data have been aggregated in bins of Δt = 4 months, starting on 1 January 1992, with consideration of the measurement gaps (i.e. the detector dead times), which are indicated by the areas shaded in grey. Horizontal error bars denote the width of the time bin; vertical error bars were calculated as per Appendix B.1.1. Letters at the figure’s top indicate the time of Ulysses’ closest approaches to Jupiter (J), the spacecraft’s perihelia (P), and its aphelia (A). Wall impacts were taken into account for the detector’s sensitivity profile (cf. Fig. B.1), and for the dust kinematics, an inflow direction of (l, b) = (255.41° ,5.03° ) with a speed of vISD, ∞ = 26 km/s was assumed (Swaczyna et al. 2018). (After Janisch 2021, Fig. 5.7.)
Current usage metrics show cumulative count of Article Views (full-text article views including HTML views, PDF and ePub downloads, according to the available data) and Abstracts Views on Vision4Press platform.
Data correspond to usage on the plateform after 2015. The current usage metrics is available 48-96 hours after online publication and is updated daily on week days.
Initial download of the metrics may take a while.