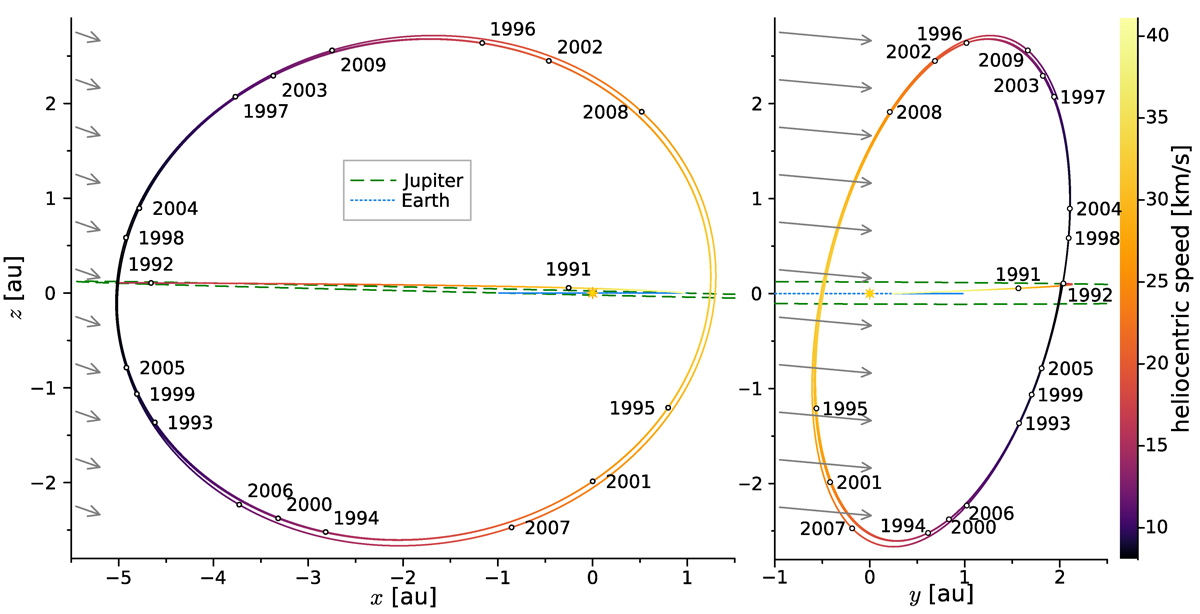
Fig. 3.
Download original image
Ulysses orbit projected onto the xz- (left) and yz-plane (right), colour-coded according to heliocentric speed. Jupiter’s and Earth’s orbits are indicated as dashed green and dotted blue lines, respectively. The dark grey arrows indicate projections of the ISD inflow direction and are identically scaled in both panels. (See Landgraf 1998, Fig. 2.5.)
Current usage metrics show cumulative count of Article Views (full-text article views including HTML views, PDF and ePub downloads, according to the available data) and Abstracts Views on Vision4Press platform.
Data correspond to usage on the plateform after 2015. The current usage metrics is available 48-96 hours after online publication and is updated daily on week days.
Initial download of the metrics may take a while.