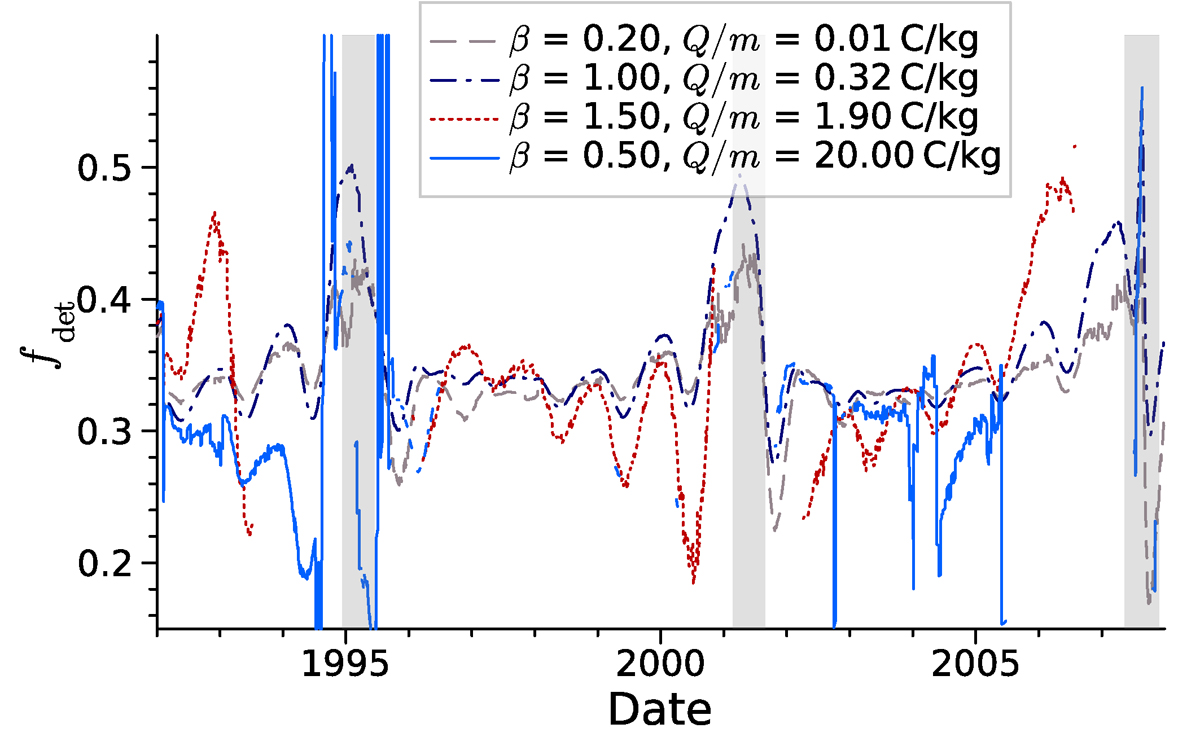
Fig. D.3.
Download original image
Time-dependent detector transfer function, fdet, of the ISD flux that can be measured compared to the ISD flux that reaches Ulysses, for the same four parameter sets as in Fig. D.2, corresponding to particle sizes of a ≈ 2.30 μm (dashed grey line), a ≈ 4.07 × 10⁻¹ μm (dash-dotted navy line), a ≈ 1.67 × 10⁻¹ μm (dotted red line), and a ≈ 5.15 × 10⁻² μm (solid blue line), using daily data points.
Current usage metrics show cumulative count of Article Views (full-text article views including HTML views, PDF and ePub downloads, according to the available data) and Abstracts Views on Vision4Press platform.
Data correspond to usage on the plateform after 2015. The current usage metrics is available 48-96 hours after online publication and is updated daily on week days.
Initial download of the metrics may take a while.