Fig. B.3.
Download original image
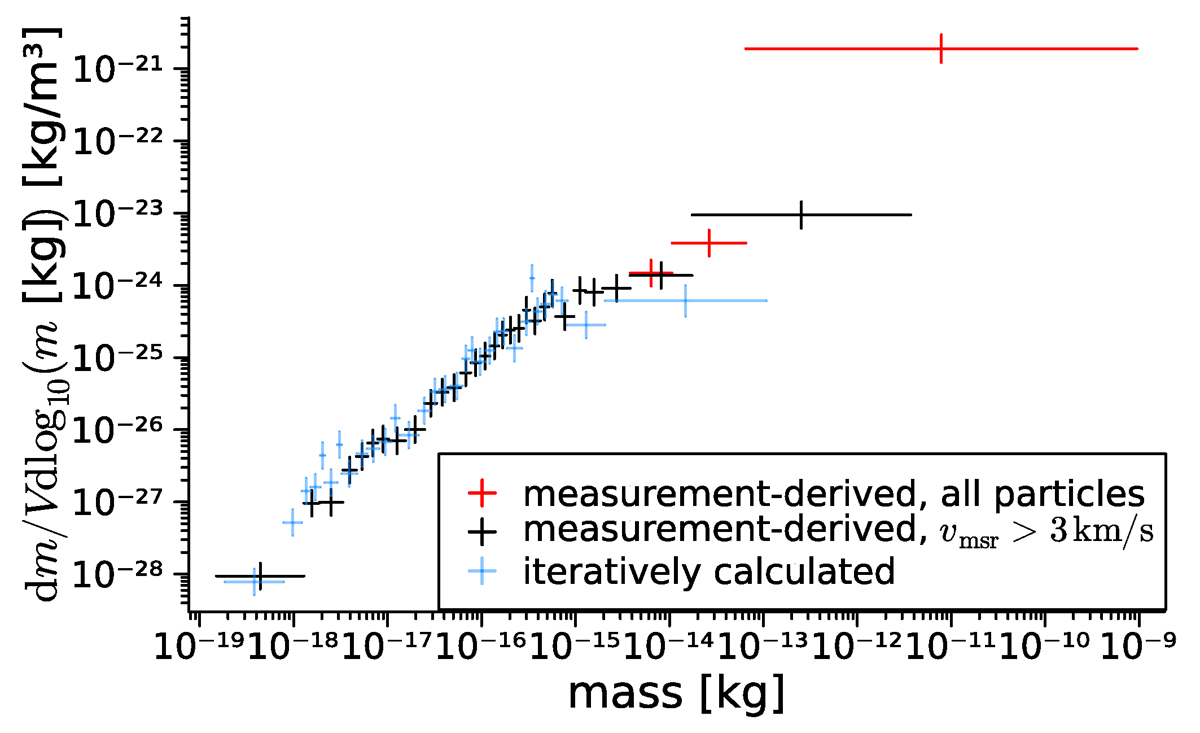
Differential mass density distribution for the measurement-derived masses, including (red) or excluding (black) the particles with vmsr < 3 km/s that most likely feature severely overestimated masses, and for the iteratively calculated masses (blue), of the Krüger subset in mass bins of N = 30 particles each. The horizontal error bars indicate the width of the mass bins, and the vertical error bars stem from the uncertainty of the mass determination, scaled by ![]() . (See Landgraf 1998, Fig. 5.3, and Frisch et al. 1999, Fig. 2.)
. (See Landgraf 1998, Fig. 5.3, and Frisch et al. 1999, Fig. 2.)
Current usage metrics show cumulative count of Article Views (full-text article views including HTML views, PDF and ePub downloads, according to the available data) and Abstracts Views on Vision4Press platform.
Data correspond to usage on the plateform after 2015. The current usage metrics is available 48-96 hours after online publication and is updated daily on week days.
Initial download of the metrics may take a while.