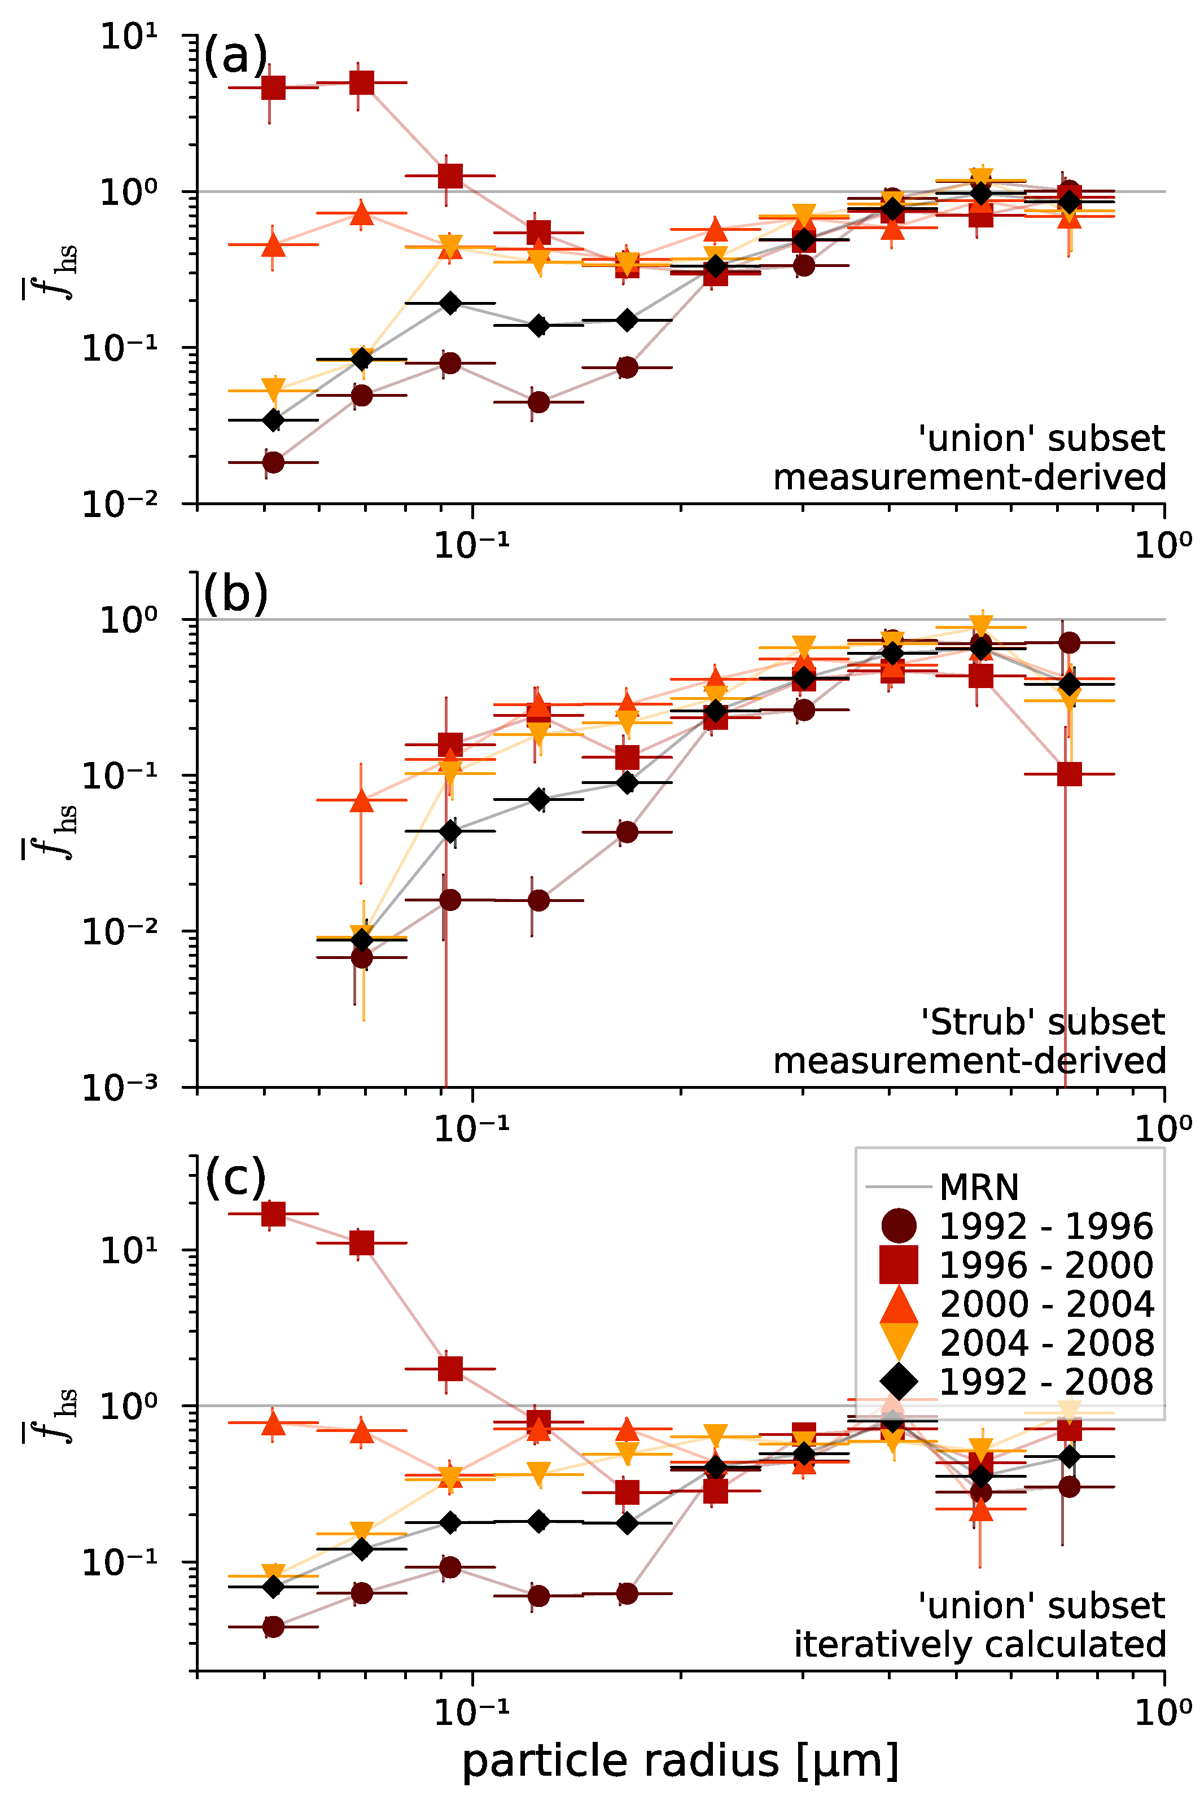
Fig. 12.
Download original image
Heliosheath filtering function, Eq. (9), in relation to the particle size, for the same time periods as Fig. 11, for the union subset with measurement-derived masses (panel a), for the Strub subset with measurement-derived masses (panel b), and for the union subset with iteratively calculated masses (panel c). The vertical error bars correspond to the (assumed) Poissonian standard deviation of the number of particles within the respective size and time bin (cf. Appendix D.5), (see Hunziker et al., in prep.).
Current usage metrics show cumulative count of Article Views (full-text article views including HTML views, PDF and ePub downloads, according to the available data) and Abstracts Views on Vision4Press platform.
Data correspond to usage on the plateform after 2015. The current usage metrics is available 48-96 hours after online publication and is updated daily on week days.
Initial download of the metrics may take a while.