Fig. 11.
Download original image
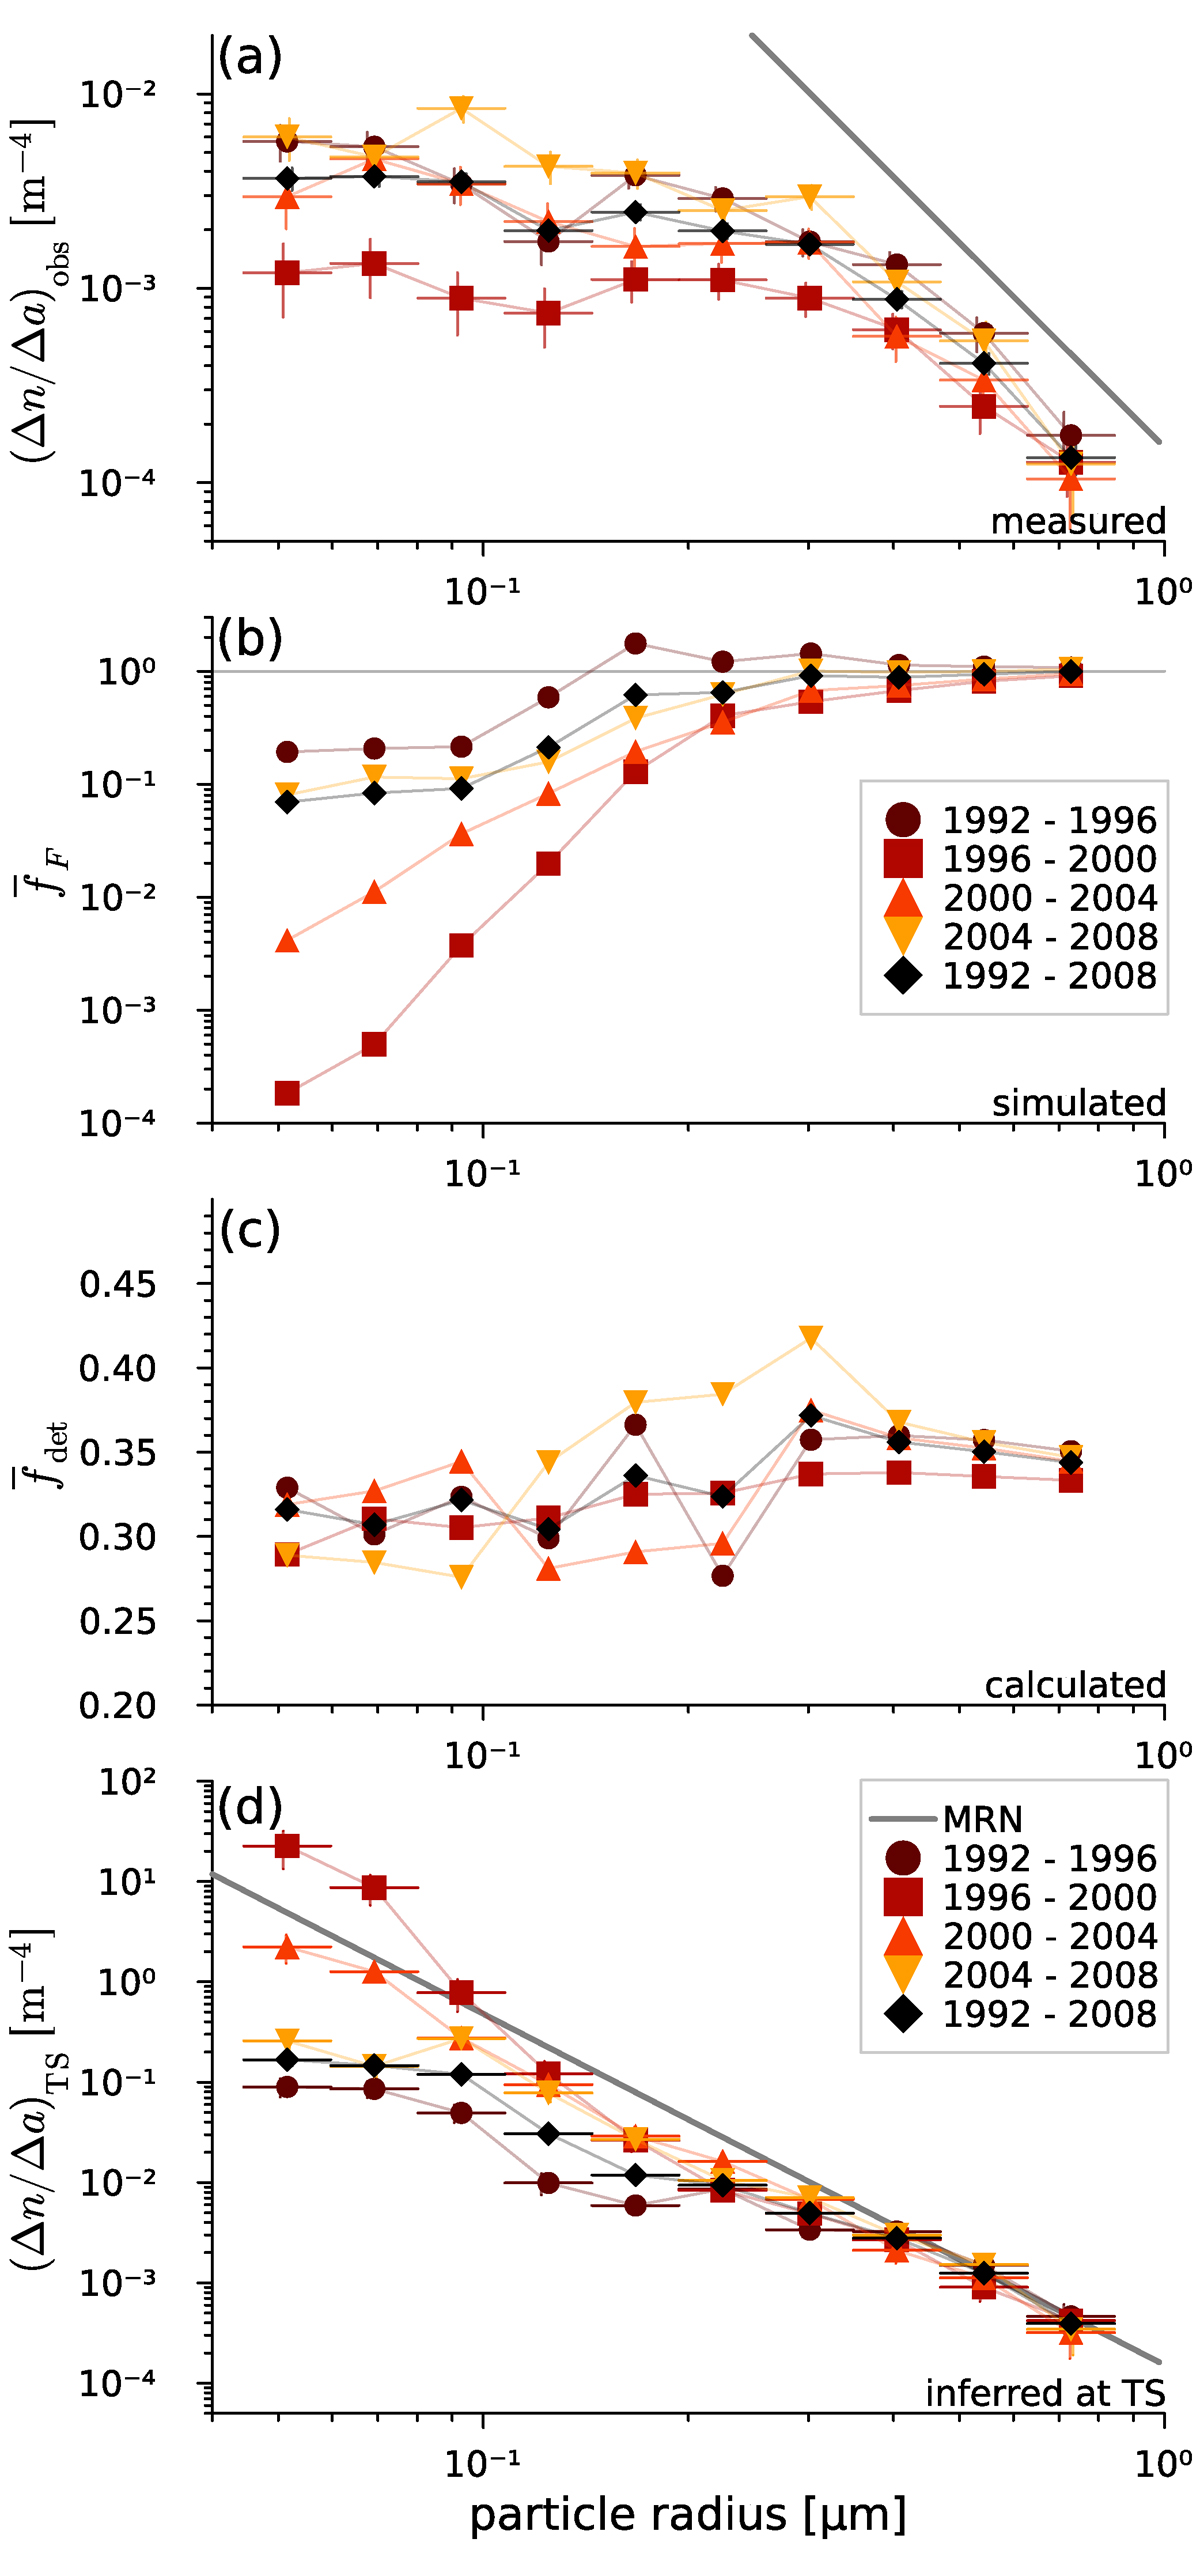
Measurement-derived differential size distribution, (Δn/Δa)obs (panel a); time-averaged modulation factor through forces in the Solar System, ![]() (panel b); time-averaged detector transfer function,
(panel b); time-averaged detector transfer function, ![]() (panel c); and inferred differential size distribution at the termination shock, (Δn/Δa)TS (panel d), for the time periods of 1992–1996 (maroon circles), 1996–2000 (red squares), 2000–2004 (orange triangles), 2004–2008 (yellow triangles), and spanning the entire time range of 1992–2008 (black diamonds). The measurement-derived masses of the union subset in the size bins given by Table D.1 were used; particles outside a ∉ [0.044, 0.84] μm have been discarded because no corresponding simulations were available. The extended MRN distribution, Eq. (10), has been graphed for carbonaceous and silicate grains with a hydrogen nuclei number density of nH = 0.1 cm−3 in panels (a) and (d). The vertical error bars correspond to the (assumed) Poissonian standard deviation of the number of particles within the respective size and time bin (cf. Appendix D.5). (See Hunziker et al., in prep.).
(panel c); and inferred differential size distribution at the termination shock, (Δn/Δa)TS (panel d), for the time periods of 1992–1996 (maroon circles), 1996–2000 (red squares), 2000–2004 (orange triangles), 2004–2008 (yellow triangles), and spanning the entire time range of 1992–2008 (black diamonds). The measurement-derived masses of the union subset in the size bins given by Table D.1 were used; particles outside a ∉ [0.044, 0.84] μm have been discarded because no corresponding simulations were available. The extended MRN distribution, Eq. (10), has been graphed for carbonaceous and silicate grains with a hydrogen nuclei number density of nH = 0.1 cm−3 in panels (a) and (d). The vertical error bars correspond to the (assumed) Poissonian standard deviation of the number of particles within the respective size and time bin (cf. Appendix D.5). (See Hunziker et al., in prep.).
Current usage metrics show cumulative count of Article Views (full-text article views including HTML views, PDF and ePub downloads, according to the available data) and Abstracts Views on Vision4Press platform.
Data correspond to usage on the plateform after 2015. The current usage metrics is available 48-96 hours after online publication and is updated daily on week days.
Initial download of the metrics may take a while.