Fig. 1
Download original image
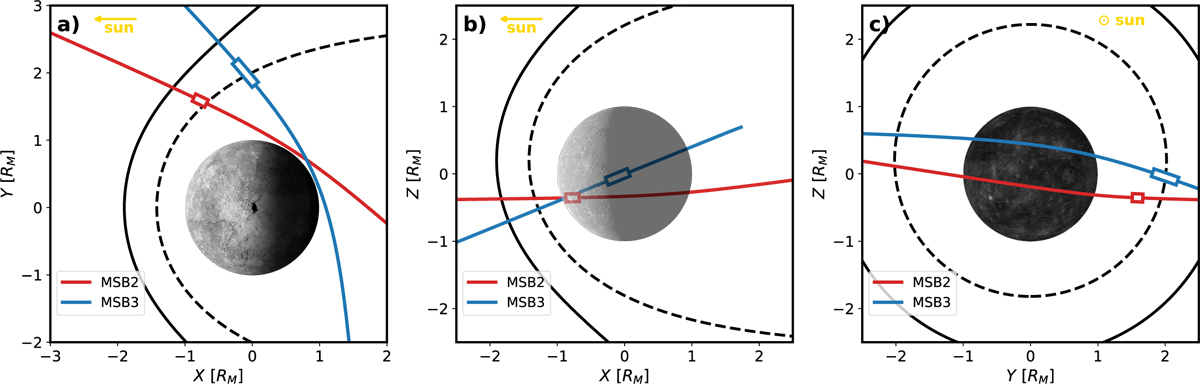
Trajectories and target magnetosheath interval. Panel a shows the top view (xy-plane), panel b shows the side view from the dawnside (xz-plane), and panel c shows the view from the back (yz-plane). MASO coordinates are used. The BepiColombo MSB2 and MSB3 trajectories are respectively shown with a solid red and solid blue line, and the PICAM measurement time frames are indicated in rectangles. Models for the magnetopause and bow shock are illustrated by the black dashed (Winslow et al. 2013) and black solid (Slavin et al. 2009; Winslow et al. 2013) lines at X, Y, Z = 0, respectively.
Current usage metrics show cumulative count of Article Views (full-text article views including HTML views, PDF and ePub downloads, according to the available data) and Abstracts Views on Vision4Press platform.
Data correspond to usage on the plateform after 2015. The current usage metrics is available 48-96 hours after online publication and is updated daily on week days.
Initial download of the metrics may take a while.