Fig. C.1
Download original image
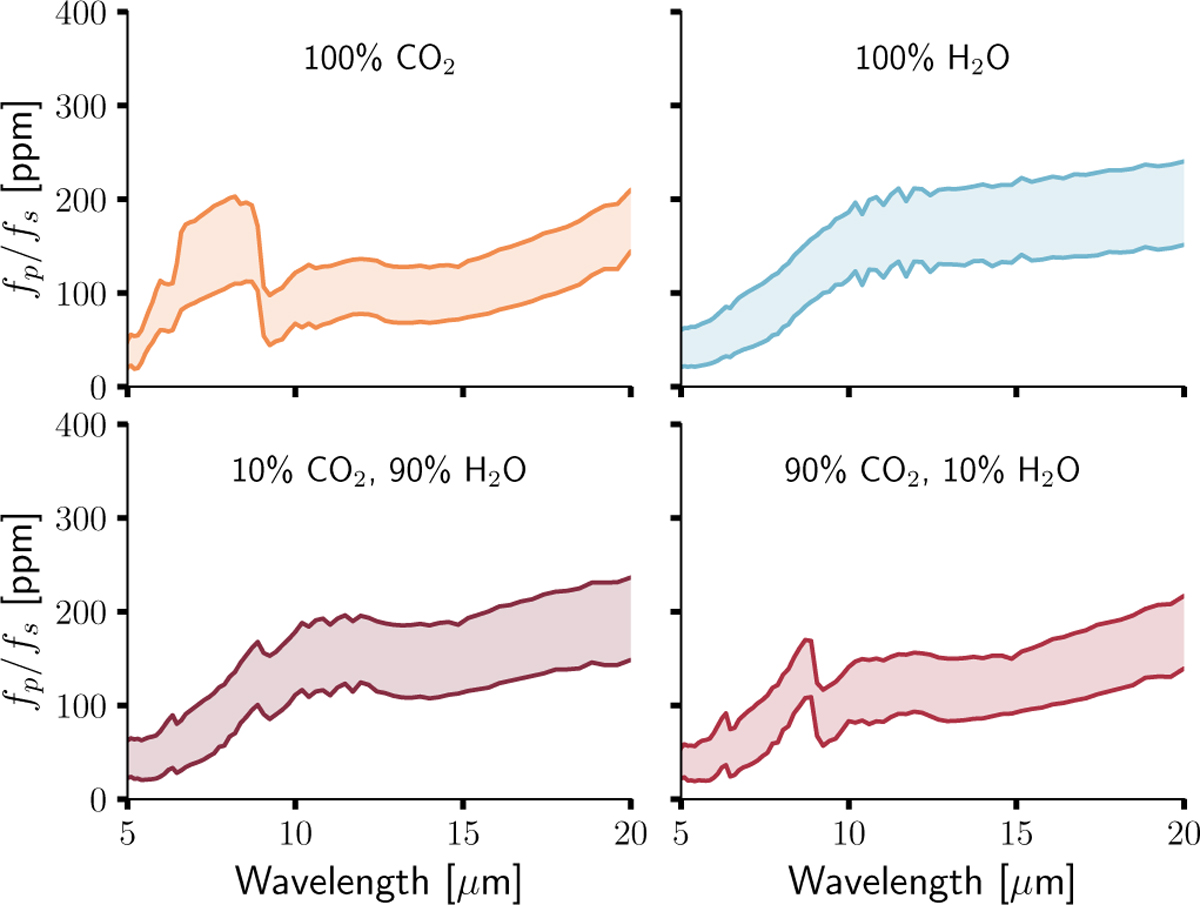
Emission spectra for different atmospheric scenarios. The curves show the planetary flux to stellar flux ratio in ppm as a function of wavelength in μm. Each panel corresponds to the atmospheric composition labelled on the top of the panel. In each panel, the top curve represents the model for no heat redistribution (f=2/3), while the bottom curve is for full redistribution (f=1/4). The shaded area covers the scenarios in between the boundary cases.
Current usage metrics show cumulative count of Article Views (full-text article views including HTML views, PDF and ePub downloads, according to the available data) and Abstracts Views on Vision4Press platform.
Data correspond to usage on the plateform after 2015. The current usage metrics is available 48-96 hours after online publication and is updated daily on week days.
Initial download of the metrics may take a while.