Fig. B.1
Download original image
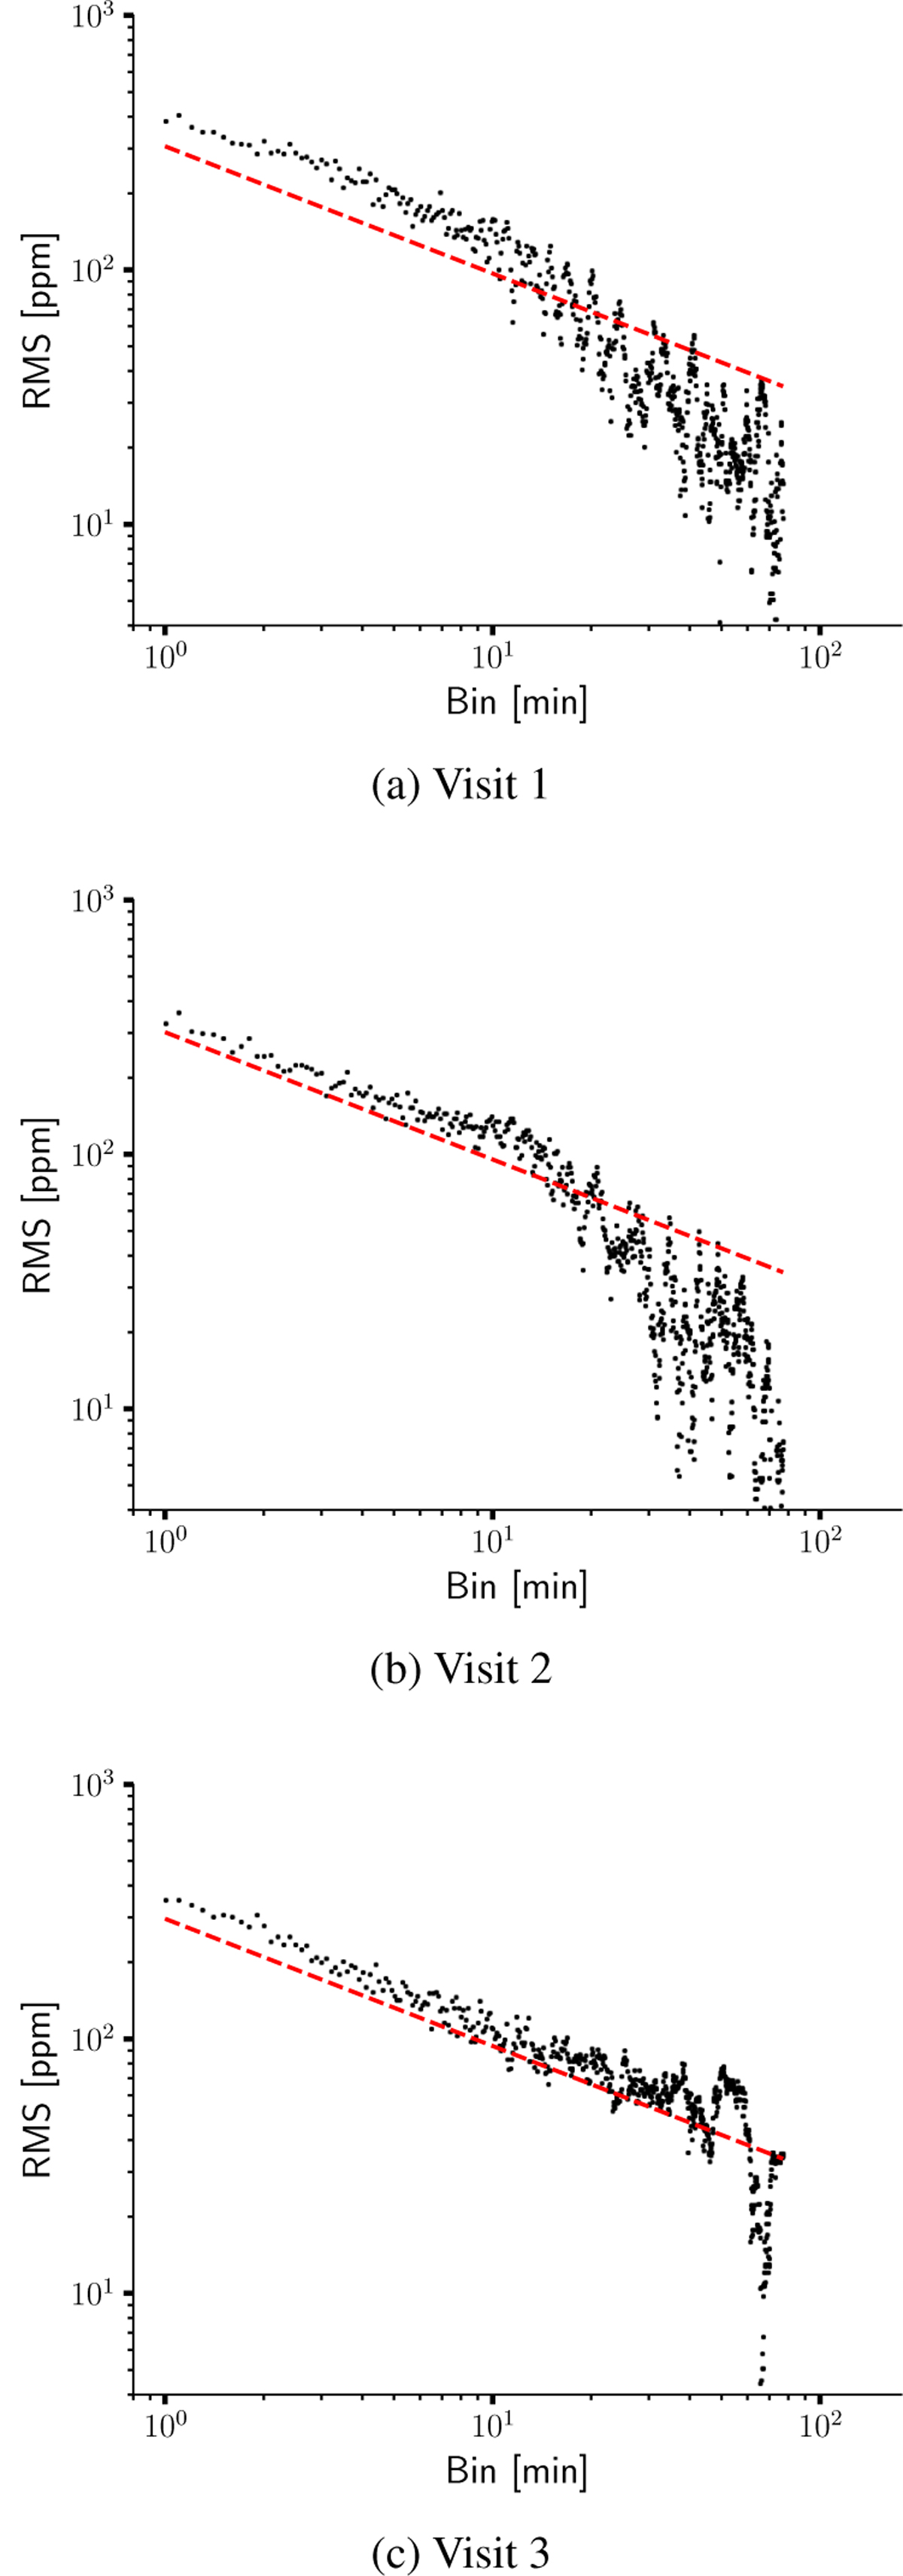
Photometric residual RMS as a function of bin size in minutes. The red dashed line shows the expected Poissonian noise precision normalised to the unbinned RMS. The panel on the left corresponds to visit 1, the middle panel to visit 2 and the right panel to visit 3.
Current usage metrics show cumulative count of Article Views (full-text article views including HTML views, PDF and ePub downloads, according to the available data) and Abstracts Views on Vision4Press platform.
Data correspond to usage on the plateform after 2015. The current usage metrics is available 48-96 hours after online publication and is updated daily on week days.
Initial download of the metrics may take a while.