Fig. 6
Download original image
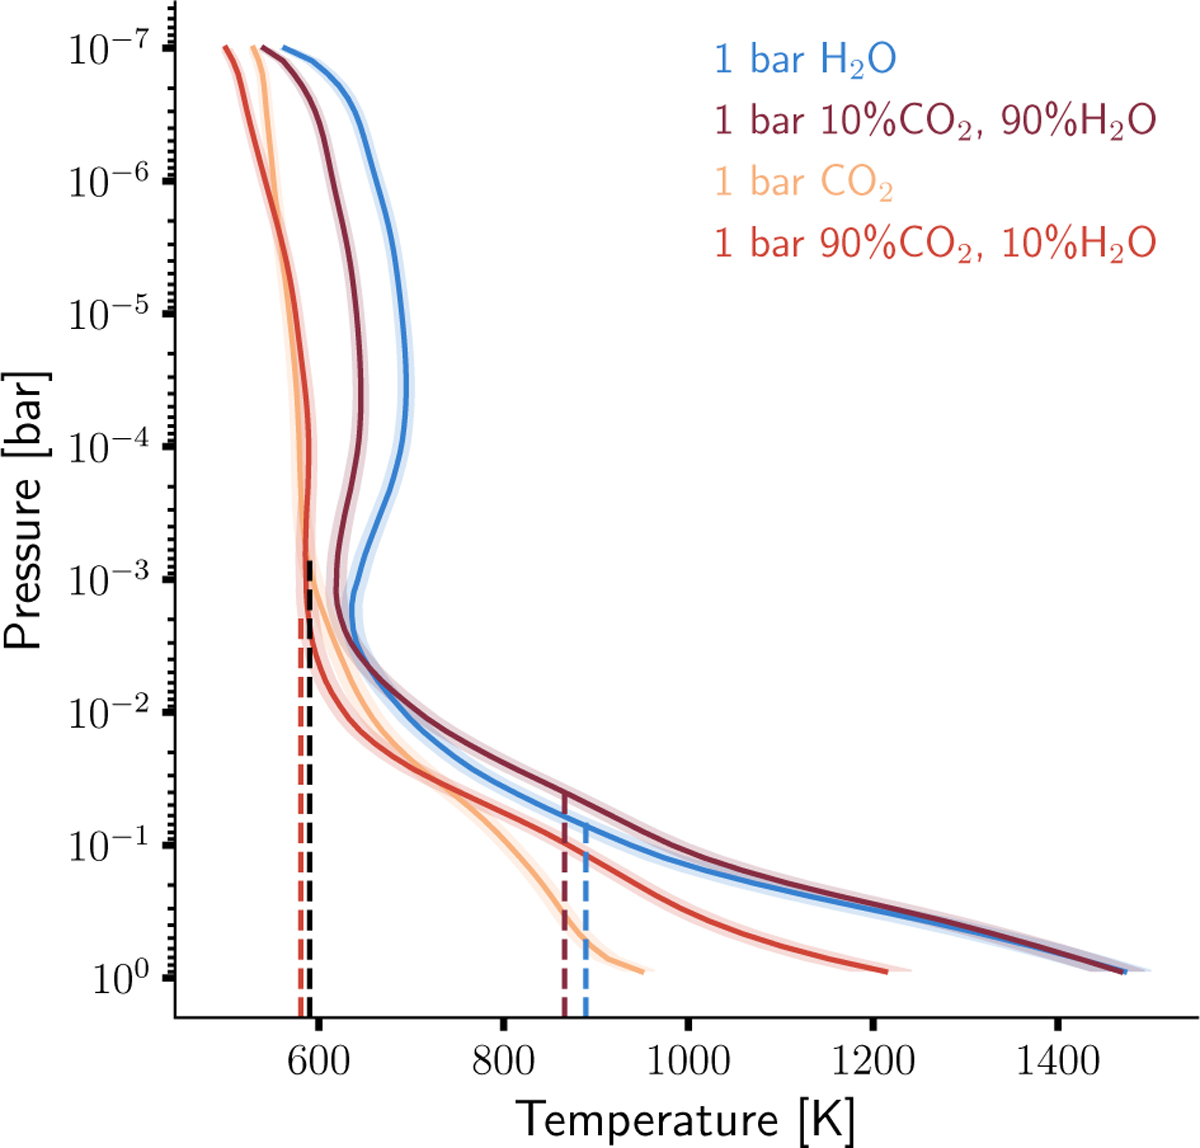
Temperature-pressure profiles of an atmosphere at 1 bar for varying atmospheric compositions of CO2 and H2O. The different models are colour-coded in the legend. The shaded region shows the 1σ confidence interval. The vertical dashed lines depict the brightness temperature of each model at 15 μm, colour-coded except for the CO2 atmosphere for clarity.
Current usage metrics show cumulative count of Article Views (full-text article views including HTML views, PDF and ePub downloads, according to the available data) and Abstracts Views on Vision4Press platform.
Data correspond to usage on the plateform after 2015. The current usage metrics is available 48-96 hours after online publication and is updated daily on week days.
Initial download of the metrics may take a while.