Fig. 5
Download original image
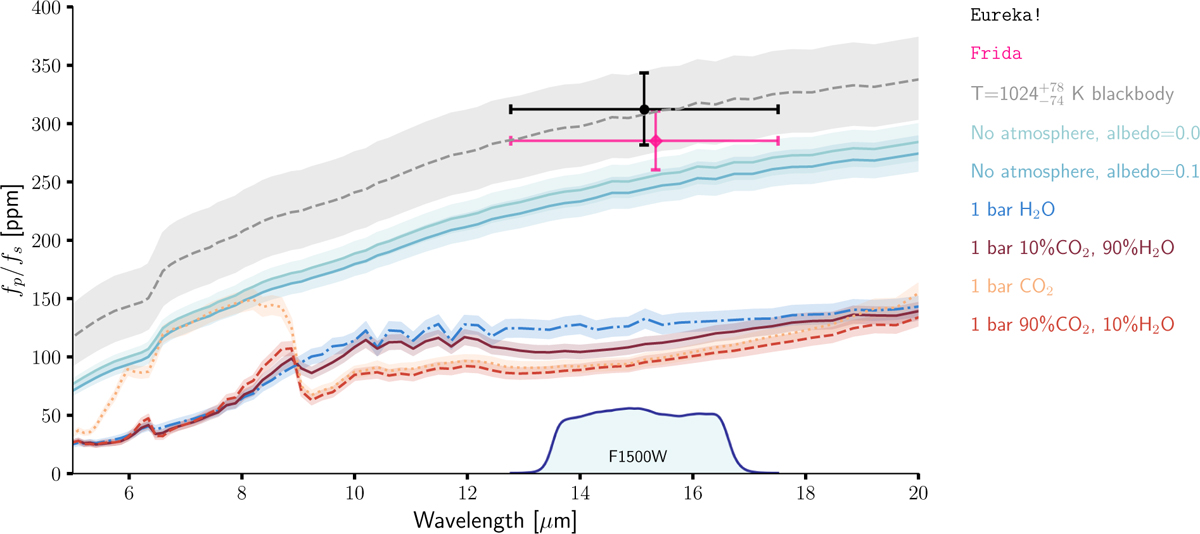
Emission spectra for different atmospheric scenarios. The curves show the ratio of planetary to stellar flux in ppm as a function of wavelength in μm. In all cases, we considered a surface albedo of 0.1 and a heat redistribution factor based on Koll (2022) as colour-coded in the legend, ordered by the corresponding location of the model in the 15 μm bandpass. Only the no-atmosphere cases have an albedo of 0 and 0.1 and zero heat redistribution. The dashed grey line and the shaded area show the blackbody emission at 1024 K and in 1σ confidence intervals. The black dot shows the measured joint occultation depth with its 1σ uncertainty, and the pink diamond shows the measured value from the independent analysis using Frida. The blue curve and shaded light blue area at the bottom shows the response function of the F1500W filter.
Current usage metrics show cumulative count of Article Views (full-text article views including HTML views, PDF and ePub downloads, according to the available data) and Abstracts Views on Vision4Press platform.
Data correspond to usage on the plateform after 2015. The current usage metrics is available 48-96 hours after online publication and is updated daily on week days.
Initial download of the metrics may take a while.