Fig. 4
Download original image
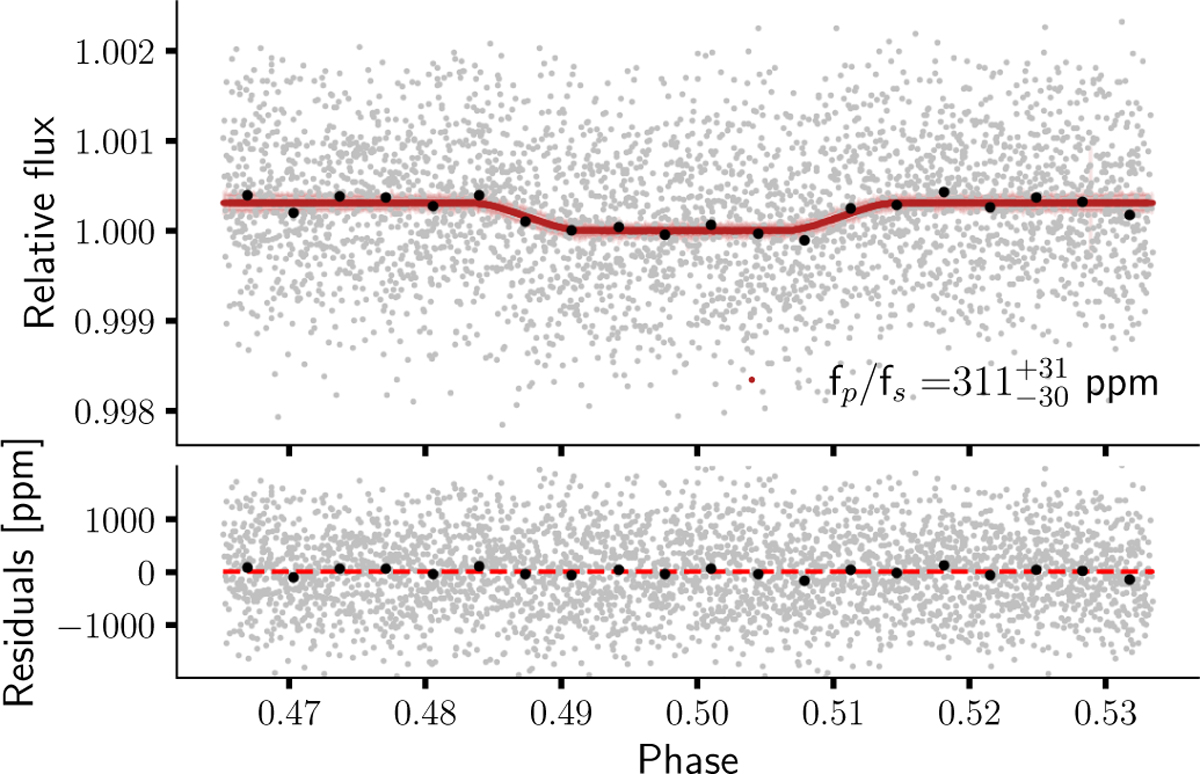
Phase-folded light curves of TOI-1468 b. The top panel shows detrended flux measurements phase-folded at the orbital period of the panel. The grey points show the detrended flux measurements. The red line represents the best-fit joint occultation model, and the light red shaded area is the 95% highest density interval (HDI). The black dots show the binned data. The bottom panel shows the residuals in ppm after removing the best-fit model, and the dashed red line displays the zero value for clarity.
Current usage metrics show cumulative count of Article Views (full-text article views including HTML views, PDF and ePub downloads, according to the available data) and Abstracts Views on Vision4Press platform.
Data correspond to usage on the plateform after 2015. The current usage metrics is available 48-96 hours after online publication and is updated daily on week days.
Initial download of the metrics may take a while.