| Issue |
A&A
Volume 698, June 2025
|
|
|---|---|---|
| Article Number | A315 | |
| Number of page(s) | 7 | |
| Section | The Sun and the Heliosphere | |
| DOI | https://doi.org/10.1051/0004-6361/202453415 | |
| Published online | 24 June 2025 | |
Dynamic evolution of the vortices in a filament and a prominence
1
School of Physics and Optoelectronic Engineering, Anhui University, Hefei 230601, China
2
Beijing Planetarium, Beijing Academy of Science and Technology, Beijing 100044, China
⋆ Corresponding author: This email address is being protected from spambots. You need JavaScript enabled to view it.
, This email address is being protected from spambots. You need JavaScript enabled to view it.
Received:
12
December
2024
Accepted:
29
April
2025
Abstract
Context. Although vortices have been observed in the solar atmosphere over the past few decades, vortices within the fine structures of solar filaments (prominences) have rarely been reported.
Aims. This report is to study the vortices inside the fine structures of a filament (case 1) and a prominence (case 2), and to reveal the dynamic evolution of these vortices.
Methods. Based on multi-wavelength observations from the New Vacuum Solar Telescope (NVST) and the Solar Dynamics Observatory, we tracked the evolution of the vortices inside the fine structures of the filament and the prominence by using the technique of the differential affine velocity estimator.
Results. In case 1, we detected a clockwise vortex within the spine of a filament in the southwest of the solar disc on 3 June 2023. The average projection speeds of the vortex in the NVST Hα line and the Atmospheric Imaging Assembly (AIA) 171 Å wavelength were 1.16 ± 0.09 km s−1 and 4.30 ± 0.91 km s−1, respectively. In case 2, a counterclockwise single vortex first appeared within a prominence on 6 September 2023 at the northwestern limb of the Sun, with average projection speeds of 2.56 ± 0.03 km s−1 and 2.86 ± 0.76 km s−1 in the NVST Hα and AIA 193 Å observations, separately. Then, several plumes were observed and intruded into the early single vortex. Subsequently, this single vortex split into three vortices.
Conclusions. We suggest that the internal kink instability may contribute to the formation of the single vortex in both cases. The intrusions of the plumes in case 2 possibly perturb the magnetic field of the single vortex and thus lead to its split. These results imply that the upward disturbance from the lower atmosphere can significantly change the structure and kinematic characteristics of the upper atmosphere.
Key words: Sun: atmosphere / Sun: chromosphere / Sun: filaments / prominences
© The Authors 2025
 Open Access article, published by EDP Sciences, under the terms of the Creative Commons Attribution License (https://creativecommons.org/licenses/by/4.0), which permits unrestricted use, distribution, and reproduction in any medium, provided the original work is properly cited.
This article is published in open access under the Subscribe to Open model. This email address is being protected from spambots. You need JavaScript enabled to view it. to support open access publication.
1. Introduction
Solar filaments, which appear as dark filamentary objects when they are observed on the solar disc, are magnetic structures containing relatively dense and cool plasmas, ordinarily suspended stably in the corona above a photospheric magnetic polarity inversion line (Hirayama 1985; Mackay et al. 2010; Parenti 2014). When observed above the solar limb in the Hα line, they usually appear as bright features and are referred to as prominences (Martin 1998; Mackay et al. 2010; Chen et al. 2020). In high-resolution observations, prominences are composed of numerous thin threads (Lin et al. 2005; Ning et al. 2009; Yan et al. 2015), and mass flows are ubiquitous along these threads. As for quiescent prominences, their main bodies remain almost stationary, while their fine structures change rather rapidly (Heinzel 2007). The dynamics of these prominence fine structures will cause plasma instability (Zirker et al. 1998; Chae et al. 2000; Zhang et al. 2017).
Previous observational research has revealed dynamical processes of the prominence fine structures, such as the counter-streaming phenomenon (Zirker et al. 1998), the longitudinal oscillation of the prominence (Lin et al. 2003), the tornadoes related to prominences (Su et al. 2012; Wedemeyer et al. 2013; Gunár et al. 2023), and a large rotational flow in a prominence and cavity (Li et al. 2012). In recent years, vortices in the prominences have been reported. For example, Yang et al. (2018) found that there were small-scale and short-duration vortices, which were observed to float along the stream and finally to disappear in a prominence. Rapidly developing vortex-like structures with a counterclockwise or clockwise direction in a prominence were reported (Li et al. 2018). Afterwards, Awasthi & Liu (2019) obtained a comprehensive picture of mass motions revealing a counterclockwise rotation inside the bubble of a prominence. Besides, vortices related to the Kármán Vortex Street (KVS; Williamson 1996; Matsumoto 1999) instability were detected, and they were considered to be responsible for the destabilization of the prominence (Zhang et al. 2024). Nevertheless, the above phenomena about vortices all occurred at the edge of the Sun and were related to dynamics of a single vortex. To this point, we have not found any research on vortices occurring within the spine of a filament on the solar disc. In this report, a vortex appearing within the spine of a filament on the solar disc is first presented. Also, to our knowledge, we first report the phenomenon of a single vortex evolving into three vortices in a prominence.
2. Observation and data analysis
In this study, we investigate the vortices inside a filament (case 1) and a prominence (case 2). In case 1, a vortex appeared within the filament spine. The filament was situated in the southwest (S25°, W15°) of the solar disc, observed by the New Vacuum Solar Telescope (NVST; Liu et al. 2014) from 02:05 UT to 04:56 UT on 3 June 2023. In case 2, another vortex phenomenon was detected in the prominence. The prominence was located at the northwestern edge (N75°, W22°) of the Sun, observed by the NVST from 01:27 UT to 02:30 UT on 6 September 2023. The NVST data are taken in the Hα 6562.8 Å line, and the Hα images have a field of view (FOV) of 169″ × 169″ with a spatial resolution of 0 165 and a time cadence of 42 s (Xiang et al. 2016; Cai et al. 2022). To comprehend the dynamics of the filament (prominence) fine structures in the extreme-ultraviolet (EUV) observations, we employed multi-wavelength data with a spatial resolution of 0
 6 and a time cadence of 12 s from the Solar Dynamics Observatory (SDO; Pesnell et al. 2012)/Atmospheric Imaging Assembly (AIA; Lemen et al. 2012). The AIA data were rotated differentially to reference times (02:00:00 UT on 3 June 2023 for case 1 and 01:00:00 UT on 6 September 2023 for case 2). The NVST and the SDO images were co-aligned with specific features by the cross-correlation method. In addition, we used the full disc Hα images from the Global Oscillation Network Group (GONG; Harvey et al. 1996) to display the exact locations of the filament and the prominence.
The technique of the differential affine velocity estimator (DAVE; Schuck 2006) is widely applied in solar research. Here, we used the DAVE algorithm to obtain the velocity fields of the vortices between two NVST Hα images, two AIA 171 Å images, and two AIA 193 Å images. The earlier image was set as the reference image and the later image as the target image. Finally, the DAVE velocity fields are indicated by arrows (see Figs. 2–5). Besides, we used different window sizes to calculate DAVE velocity fields in order to obtain the error bars of the velocities. We also searched for several dark or bright features within the vortices, and measured their velocities manually so that we could compare them with the corresponding DAVE velocity fields. For each feature, such as the one (E2) in Fig. 2(a3), we started to record its position (see the magenta symbol “×” in Fig. 2(c1)) at 02:32:00 UT. Then, we also recorded its time (02:32:41 UT) and position (see the cyan symbol “×” in Fig. 2(c2)) in the adjacent Hα image. The velocity was measured to be 3.00 ± 0.80 km s−1. The evolutionary direction of the feature is indicated by the cyan arrow (Figs. 2(c1)–(c2)), which is roughly consistent with the corresponding DAVE velocity field arrow marked in cyan (see Fig. 2(a3)). In all, we tracked and recorded four dark or bright features (see E1–E2 in Fig. 2 and E3–E4 in Fig. 3).
3. Results
Figure 1 shows the filament (case 1 in Figs. 1(a1)–(a2) and 1(b1)–(b2)) and the prominence (case 2 in Figs. 1(c1)–(c2) and 1(d1)–(d2)). The filament was located in the southern hemisphere of the solar disc (Figs. 1(a1) and 1(b1)), while the prominence was located on the northern limb of the Sun (Figs. 1(c1) and 1(d1)).
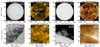 |
Fig. 1. Multi-wavelength observations showing the locations of the filament (case 1) and the prominence (case 2) where the vortices occurred. The left four panels, (a1)–(a2) and (b1)–(b2), show case 1. Panels (a1) and (b1): GONG Hα image and AIA 171 Å image showing the location of the filament. The green rectangle in panel (a1) outlines the FOV of panel (a2), the Hα image from the NVST. The green rectangle in panel (b1) outlines the FOV of panel (b2), the 171 Å image from the SDO/AIA. The red rectangles in panels (a2) and (b2) outline the FOV of Figs. 2(a1)–(a4) and 2(d1)–(d3). The right four panels, (c1)–(c2) and (d1)–(d2), show case 2. Panels (c1) and (d1): GONG Hα image and AIA 193 Å image showing the location of the prominence. The green rectangle in panel (c1) outlines the FOV of panel (c2), the Hα image from the NVST. The green rectangle in panel (d1) outlines the FOV of panel (d2), the 193 Å image from the SDO/AIA. The cyan rectangles in panels (c2) and (d2) outline the FOV of Figs. 3(a1)–(a4), 3(d1)–(d3), 4, 5(a1)–(a4) and 5(b1)–(b3). |
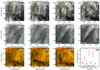 |
Fig. 2. Temporal evolution of the clockwise vortex that appeared within the spine of the filament (case 1) on 3 June 2023. Panels (a1)–(a4): Vortex observed by the NVST Hα images. The yellow arrows in panels (a1)–(a4) indicate the velocity fields of the vortex based on the DAVE technique. The cyan arrows in panels (a2) and (a3) indicate the speeds of features E1 and E2 from the DAVE technique, respectively. Panels (b1)–(b2): Hα images displaying temporal evolutions of E1 in panel (a2). The positions of E1 at two moments are marked with magenta and cyan symbols “×”, respectively. Cyan arrows indicate the evolution orientations. Panels (c1)–(c2): Similar to panels (b1)–(b2), but for E2 in panel (a3). Panels (d1)–(d3): AIA 171 Å images. The red arrows in panels (d1)–(d3) indicate the velocity fields. Panel (e): Average projection speeds with error bars of the vortex from the NVST Hα observations (panels (a1)–(a4)) and the AIA 171 Å data (panels (d1)–(d3)). An animation of NVST Hα observations from 3 June 2023 at 02:05:48 UT to 03:00:15 UT, showing the evolution of the vortex, is available online. The real-time duration of this animation is 8 s. |
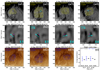 |
Fig. 3. Temporal evolution of the counterclockwise single vortex that appeared in the prominence (case 2) at the northern limb of the solar disc on 6 September 2023. Panels (a1)–(a4): NVST Hα images. The yellow arrows in panels (a1)–(a4) indicate the velocity fields of the vortex. The cyan arrows in panels (a2) and (a4) indicate the speeds of features E3 and E4 from the DAVE technique, respectively. Panels (b1)–(b2): Hα images displaying temporal evolutions of E3 in panel (a2). The positions of E3 at two moments are marked with magenta and cyan symbols “×”, respectively. Cyan arrows indicate the evolution orientations. Panels (c1)–(c2): similar to panels (b1)–(b2), but for E4 in panel (a4). Panels (d1)–(d3): AIA 193 Å images. The blue arrows in panels (d1)–(d3) indicate the velocity fields. Panel (e): Average projection speeds with error bars of the vortex from the NVST Hα observations (panels (a1)–(a4)) and the AIA 193 Å data (panels (d1)–(d3)). An animation of NVST Hα observations from 6 September 2023 at 01:27:14 UT to 02:04:27 UT, showing the evolution of the single vortex before the split, is available online. The real-time duration of this animation is 5 s. |
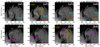 |
Fig. 4. Dynamic characteristics from single-vortex stage to three-vortex one in case 2. Panels (a1)–(a4): Plumes 1–3 are pointed out by the cyan, red, and green arrows, respectively. The yellow arrows in panel (a2) indicate the velocity fields of the single vortex. Panels (b1)–(b4): Bright upflow is pointed out by magenta arrows. The yellow arrows in panel (b3) indicate the velocity fields of the three vortices. An animation of NVST Hα observations from 6 September 2023 at 01:42:24 UT to 02:29:56 UT, showing the evolutions of the plumes, the bright upflow and the single vortex splitting into three vortices, is available online. The real-time duration of this animation is 6 s. |
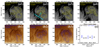 |
Fig. 5. Temporal evolution of the three vortices in case 2. Panels (a1)–(a4): NVST Hα images. The yellow arrows in panels (a1)–(a4) indicate the velocity fields of the vortices. In panel (a2), the combination part of the three vortices is pointed by the cyan arrow. Panels (b1)–(b3): AIA 193 Å images. The blue arrows in panels (b1)–(b3) indicate the velocity fields. Panel (c): Average projection speeds with error bars of the vortices from the NVST Hα observations (panels (a1)–(a4)) and the AIA 193 Å data (panels (b1)–(b3)). |
3.1. The vortex within the spine of a filament (case 1)
In case 1, a clockwise vortex was observed from 02:09 UT to 02:45 UT on 3 June 2023 (Fig. 2, see animation 1 available online). Then we used the DAVE algorithm to obtain the velocity fields of the vortex in the Hα 6562.8 Å line. The vortex first formed around 02:09 UT (Fig. 2(a1)) with the size of 10″ × 11″, and the average projection speed was 1.33 ± 0.14 km s−1. In the following six minutes, it began to expand gradually (Fig. 2(a2)). The average projection speed of the vortex around 02:15 UT was about 0.96 ± 0.10 km s−1. Subsequently, the size of the vortex reached 18″ × 20″ and the average projection speed was 1.38 ± 0.09 km s−1 around 02:32 UT (Fig. 2(a3)). Finally, the vortex broke and completely disappeared after 02:45 UT (Fig. 2(a4)). Figures 2(b1)–(b2) display the temporal evolution of feature E1 in Fig. 2(a2), and the speed of E1 is 5.92 ± 0.77 km s−1, which is similar to the speed of E1 measured by the DAVE technique (5.40 ± 0.10 km s−1). The evolution of feature E2 in Fig. 2(a3) is displayed in Figs. 2(c1)–(c2), and the speed is 3.00 ± 0.80 km s−1, similar to the speed of E2 measured with the DAVE technique (2.84 ± 0.09 km s−1). The evolution orientations of E1 and E2 obtained through tracking artificially are generally consistent with the DAVE velocity fields. Also, this vortex was detected in AIA 171 Å images (Figs. 2(d1)–(d3)). Differently, the average projection speed was 3.10 ± 0.91 km s−1 around 02:11 UT, while the average projection speeds around 02:18 UT and 02:35 UT were 5.10 ± 0.90 km s−1 and 4.70 ± 0.94 km s−1, respectively (see Fig. 2(e)). The average projection speed throughout the entire process was about 1.16 ± 0.09 km s−1 in the NVST Hα 6562.8 Å line, and 4.30 ± 0.91 km s−1 in the AIA 171 Å wavelength. Moreover, throughout the entire process, the projection speed of the vortex remained below 7 km s−1 in the NVST Hα 6562.8 Å line and below 15 km s−1 in the AIA 171 Å wavelength.
3.2. Single vortex evolving into three vortices in a prominence (case 2)
In case 2, a single vortex evolved into three vortices in a prominence from 01:27 UT to 02:28 UT on 6 September 2023. We also used the DAVE algorithm to obtain the velocity fields of the vortices in both the Hα 6562.8 Å line and the AIA 193 Å channel (see Figs. 3 and 5).
3.2.1. Single-vortex stage
A single counterclockwise vortex in the prominence was detected near 01:27 UT (Fig. 3(a1)). Between 01:27 UT and 01:38 UT, the vortex increased gradually. Initially, the size of the vortex was approximately 19″ × 13″. Then, the vortex became larger and its size was about 22″ × 26″ (Fig. 3(a2)). Subsequently, it gradually decreased to a size of 20″ × 17″ at 01:47:54 UT (Fig. 3(a3)). During this period, the centre of this single vortex first moved slightly towards the west, and then towards the east in the following time until 02:03:04 UT (Fig. 3(a4), see animation 2 available online). The average projection speeds of the single vortex around 01:27 UT, 01:37 UT, 01:47 UT, and 02:03 UT were 2.56 ± 0.03 km s−1, 3.00 ± 0.04 km s−1, 3.00 ± 0.01 km s−1, and 2.65 ± 0.02 km s−1, respectively. Similar to case 1, features E3 (see Figs. 3(b1)–(b2)) and E4 (see Figs. 3(c1)–(c2)) in case 2 are tracked and studied by us. Their speeds and orientations are generally consistent with the ones from the DAVE velocity fields (see cyan arrows in Figs. 3(a2) and (a4)). In the AIA 193 Å channel, the velocity fields of the vortex were roughly consistent with those in the Hα 6562.8 Å line (see Figs. 3(d1)–(d3)). The average projection speeds around 01:24 UT, 01:34 UT, and 01:47 UT were 2.86 ± 0.76 km s−1, 3.09 ± 0.72 km s−1, and 2.93 ± 0.76 km s−1, respectively (see Fig. 3(e)). Throughout the single-vortex stage, the average projection speed of the vortex was about 2.80 ± 0.02 km s−1 in the NVST Hα 6562.8 Å line, and 2.96 ± 0.74 km s−1 in the AIA 193 Å channel. In addition, throughout the entire single-vortex stage, the projection speed of the single vortex remained below 14 km s−1 in the NVST Hα 6562.8 Å line and below 8 km s−1 in the AIA 193 Å channel.
3.2.2. Dynamic characteristics from single-vortex stage to three-vortex one
Based on the high-resolution observations from the NVST, we investigate the detailed evolution of the prominence, and two distinct dynamic characteristics are found. One is that several small-scale plumes ascended one by one from the bottom of the prominence towards the southwest of the single vortex after 01:42 UT (see animation 3 available online). Then, the plumes encountered the single vortex around 01:46 UT. We mark three of the plumes with arrows in Figs. 4(a1)–(a4). Among them, Plume 1 ascended with the longest distance (9420 km) and the average ascending speed between 01:42 UT and 01:54 UT was about 13 km s−1. The ascending speeds of Plume 2 and Plume 3 were around 10 km s−1 and 9 km s−1, respectively. All the plumes underwent deformation process while they rose, and their sizes diminished. The other one visible in the Hα 6562.8 Å line is that a series of bright flows went up from almost the same position where the plumes ascended (see animation 3 available online). Here, we mark the most obvious bright upflow in Figs. 4(b1)–(b4). At first, it rose at a speed of 11 km s−1 from 02:03 UT to 02:12 UT, and the brightness was not very obvious. Then it intruded into the single vortex and its brightness significantly increased from 02:12:43 UT to 02:13:24 UT (see Figs. 4(b2)–(b3)), during which the single vortex began to split into three ones. The rising speed of the bright upflow was about 17 km s−1. Several minutes later, the brightness rapidly decreased and the upflow vanished after 02:15 UT (see Fig. 4(b4)).
3.2.3. Three-vortex stage
The vortex split while the bright upflow collided and intruded into it from 02:12:43 UT to 02:15:28 UT (see Figs. 4(b2)–(b4) and 5(a1)). At the beginning of the three-vortex stage, we observed two complete vortices in the west and a fragmentary one in the east (see Fig. 5(a1)). The complete vortex in the southwest with clockwise rotation was a newly formed one, and the other two vortices with counterclockwise rotation were split from the original single vortex by the collision of the bright upflow (see Figs. 4(b2)–(b3)). The average projection speed of the vortices around 02:14 UT was about 2.05 ± 0.04 km s−1. Soon afterwards, the fragmentary vortex developed completely from 02:15:28 UT to 02:18:55 UT, and the average projection speed of the three vortices around 02:19 UT was 2.08 ± 0.08 km s−1 (see Fig. 5(a2)). Finally, the rotation of the vortices weakened and disappeared (see Figs. 5(a3)–(a4)), with the reduction of the bright upflows (see animation 3 available online). The average projection speeds around 02:21 UT and 02:27 UT were 2.35 ± 0.06 km s−1 and 2.40 ± 0.06 km s−1, respectively. The vortices were also detected in the SDO/AIA 193 Å channel. Due to the different resolution, the vortices were slightly dissimilar to those in the Hα 6562.8 Å line, but the overall trend was more or less alike (see Figs. 5(b1)–(b3)). Besides, the average projection speeds in the AIA 193 Å channel around 02:14 UT, 02:20 UT and 02:23 UT were 2.60 ± 0.43 km s−1, 2.36 ± 0.50 km s−1 and 2.36 ± 0.53 km s−1, respectively, which were relatively close to those in the Hα 6562.8 Å line (see Fig. 5(c)). The average projection speed of the vortices throughout the three-vortex stage was about 2.22 ± 0.06 km s−1 in the NVST Hα 6562.8 Å line, and in the AIA 193 Å channel 2.44 ± 0.48 km s−1. Besides, throughout the entire three-vortex stage, the projection speed of the vortices remained below 10 km s−1 in the NVST Hα 6562.8 Å line and below 8 km s−1 in the AIA 193 Å channel.
4. Summary and discussion
Based on the NVST Hα and the SDO/AIA observations, we display for the first time that the vortex occurred within the spine of a filament. The clockwise vortex lasted for about 36 minutes, enlarging from 10″ × 11″ to 18″ × 20″ in size. Subsequently, it broke and disappeared. Also, for the first time we report a vortex evolving from single to three in a prominence. The single vortex was counterclockwise at the beginning, lasting stably for about 37 minutes. Later, plumes and a series of bright upflows collided and intruded into the single vortex, and the single vortex gradually split into three vortices. The three-vortex stage lasted for about 13 minutes, and then faded away.
So far, there are several mechanisms for the formation of vortices in the prominences (filaments), such as the internal kink instability (Mikic et al. 1990; Hood et al. 2009; Keppens et al. 2019), the Kelvin-Helmholtz instability (KHI; Terradas et al. 2008; Antolin et al. 2014), and the KVS instability. As for the internal kink instability, its corresponding vortices can maintain their state for a longer period of time, and the heating signs within the vortices are absent (Awasthi & Liu 2019). When the shear speed between two layers of fluid exceeds 20 km s−1, the KHI is likely to be triggered (Zirker et al. 1998; Ahn et al. 2010; Vial & Engvold 2015), which results in the formation of vortex-like structures (Li et al. 2018; Yang et al. 2018). With regard to the KVS instability, this instability will excite two columns of vortices with opposite directions (Zhang et al. 2024). In addition, the bathtub effect is another common mechanism (Tziotziou et al. 2023). This effect is usually related to vortices at granular scales, and it may trigger photospheric vortex flows (Wedemeyer-Böhm et al. 2012), which leads to the formation of vortices in the form of tornadoes as the legs of the filaments (prominences) (Su et al. 2012; Wedemeyer et al. 2013; Tziotziou et al. 2023).
In our work, the vortex velocities of the two cases are less than 15 km s−1, and no strong shear-flow motions are observed, so the KHI may not be the mechanism for the vortices. Besides, the initial vortices in each case are single ones, so the KVS instability is possibly unrelated to case 1 and to the early stage of case 2. The vortex in case 1 is in the spine of the filament, and no obvious driven vortices in the photosphere are observed at the angular and temporal resolution of the employed SDO/Helioseismic and Magnetic Imager (Scherrer et al. 2012) data. Moreover, the vortices in case 2 are not at the leg of the prominence. It implies that these vortices are not relevant to photospheric vortex flows. In addition, we detect that the vortex in case 1 and the single vortex in case 2 are relatively stable for more than 35 minutes, which can be considered a relatively long period of time. We suggest that the internal kink instability may result in the initial vortices in the two cases.
During the transition process from the single-vortex stage to the three-vortex one in case 2, we detect the plumes (Figs. 4(a1)–(a4)) and the bright upflow (Figs. 4(b1)–(b4)), which intrude into the single vortex. The bright upflow is also a type of plume. Additionally, we find that the three vortices do not exist independently, but have a common boundary in their combination part (see Fig. 5(a2)). The two vortices in the northeast of the plume are both counterclockwise, while the other one in the southwest of the plume is clockwise (see Figs. 4(b3) and 5(a1)–(a3)). It is similar to the vortices caused by the KVS instability (e.g. Zhang et al. 2024). Thus, we tend to believe that the plumes perturb the magnetic field of the single vortex, and the KVS instability results in the vortex split from a single one into three ones.
The vortex in case 1 was observed by both the NVST and the SDO/AIA. However, the average projection speed from the NVST Hα observations is less than that from the SDO/AIA 171 Å data (see Fig. 2(e)). The NVST Hα line is used for observing the chromosphere (Liu et al. 2014), while the SDO/AIA 171 Å wavelength observes the lower corona (Lemen et al. 2012). In the solar atmosphere, the velocity of material varies with the atmospheric density, so the material in the quiet corona moves faster than that in the chromosphere; for example, a persistent small-scale tornado in the chromosphere has a velocity of 3 km s−1 to 8 km s−1 (Tziotziou et al. 2018), but the EUV cyclones in the corona have a mean speed of 35 km s−1 to 80 km s−1 (Zhang & Liu 2011). Therefore, it is possible that the different observational heights of the NVST Hα line and the SDO/AIA 171 Å wavelength contribute to the vortex speed discrepancy.
Overall, case 1 indicates the existence of the vortex in the spine of the filament and we suggest that the vortex is caused by the internal kink instability. Similar to case 1, a single vortex exists initially in case 2, and the vortex is also possibly caused by the internal kink instability. Unlike case 1, the single vortex in case 2 is in a prominence and it splits into three ones subsequently as a result of the KVS instability. However, further research is required to determine the universality of these results.
Data availability
Movies associated to Figs 2, 3, and 4 are available at https://www.aanda.org
Acknowledgments
We are grateful to an anonymous referee for constructive comments and suggestions. The observations used in our work are provided by the NVST, the SDO and the GONG teams. This work is supported by the National Natural Science Foundation of China (12073001), the Anhui Project (Z010118169), and the BJAST Budding Talent Program (23CE–BGS–07).
References
- Ahn, K., Chae, J., Cao, W., & Goode, P. R. 2010, ApJ, 721, 74 [NASA ADS] [CrossRef] [Google Scholar]
- Antolin, P., Yokoyama, T., & Van Doorsselaere, T. 2014, ApJ, 787, L22 [Google Scholar]
- Awasthi, A. K., & Liu, R. 2019, FrP, 7, 218 [Google Scholar]
- Cai, Y.-F., Yang, X., Xiang, Y.-Y., et al. 2022, RAA, 22, 065010 [Google Scholar]
- Chae, J., Denker, C., Spirock, T. J., Wang, H., & Goode, P. R. 2000, Sol. Phys., 195, 333 [NASA ADS] [CrossRef] [Google Scholar]
- Chen, P.-F., Xu, A.-A., & Ding, M.-D. 2020, RAA, 20, 166 [NASA ADS] [Google Scholar]
- Gunár, S., Labrosse, N., Luna, M., et al. 2023, Space Sci. Rev., 219, 33 [CrossRef] [Google Scholar]
- Harvey, J. W., Hill, F., Hubbard, R. P., et al. 1996, Science, 272, 1284 [Google Scholar]
- Heinzel, P. 2007, ASP Conf. Ser., 368, 271 [NASA ADS] [Google Scholar]
- Hirayama, T. 1985, Sol. Phys., 100, 415 [NASA ADS] [CrossRef] [Google Scholar]
- Hood, A. W., Browning, P. K., & van der Linden, R. A. M. 2009, A&A, 506, 913 [NASA ADS] [CrossRef] [EDP Sciences] [Google Scholar]
- Keppens, R., Guo, Y., Makwana, K., et al. 2019, RvMPP, 3, 14 [Google Scholar]
- Lemen, J. R., Title, A. M., Akin, D. J., et al. 2012, Sol. Phys., 275, 17 [Google Scholar]
- Li, X., Morgan, H., Leonard, D., & Jeska, L. 2012, ApJ, 752, L22 [NASA ADS] [CrossRef] [Google Scholar]
- Li, D., Shen, Y., Ning, Z., Zhang, Q., & Zhou, T. 2018, ApJ, 863, 192 [NASA ADS] [CrossRef] [Google Scholar]
- Lin, Y., Engvold, O., & Wiik, J. E. 2003, Sol. Phys., 216, 109 [NASA ADS] [CrossRef] [Google Scholar]
- Lin, Y., Engvold, O., der Voort, L. R. V., Wiik, J. E., & Berger, T. E., 2005, Sol. Phys., 226, 239 [NASA ADS] [CrossRef] [Google Scholar]
- Liu, Z., Xu, J., Gu, B.-Z., et al. 2014, RAA, 14, 705 [Google Scholar]
- Mackay, D. H., Karpen, J. T., Ballester, J. L., Schmieder, B., & Aulanier, G. 2010, Space Sci. Rev., 151, 333 [Google Scholar]
- Martin, S. F. 1998, Sol. Phys., 182, 107 [Google Scholar]
- Matsumoto, M. 1999, J. Fluids Struct., 13, 791 [NASA ADS] [CrossRef] [Google Scholar]
- Mikic, Z., Schnack, D. D., & van Hoven, G. 1990, ApJ, 361, 690 [CrossRef] [Google Scholar]
- Ning, Z., Cao, W., Okamoto, T. J., Ichimoto, K., & Qu, Z. Q. 2009, A&A, 499, 595 [NASA ADS] [CrossRef] [EDP Sciences] [Google Scholar]
- Parenti, S. 2014, LRSP, 11, 1 [Google Scholar]
- Pesnell, W. D., Thompson, B. J., & Chamberlin, P. C. 2012, Sol. Phys., 275, 3 [Google Scholar]
- Scherrer, P. H., Schou, J., Bush, R. I., et al. 2012, Sol. Phys., 275, 207 [Google Scholar]
- Schuck, P. W. 2006, ApJ, 646, 1358 [Google Scholar]
- Su, Y., Wang, T., Veronig, A., Temmer, M., & Gan, W. 2012, ApJ, 756, L41 [Google Scholar]
- Terradas, J., Andries, J., Goossens, M., et al. 2008, ApJ, 687, L115 [Google Scholar]
- Tziotziou, K., Tsiropoula, G., Kontogiannis, I., Scullion, E., & Doyle, J. G. 2018, A&A, 618, A51 [NASA ADS] [CrossRef] [EDP Sciences] [Google Scholar]
- Tziotziou, K., Scullion, E., Shelyag, S., et al. 2023, Space Sci. Rev., 219, 1 [NASA ADS] [CrossRef] [Google Scholar]
- Vial, J.-C., & Engvold, O. 2015, Solar Prominences (Cham: Springer), 415 [Google Scholar]
- Wedemeyer, S., Scullion, E., Rouppe van der Voort, L., Bosnjak, A., & Antolin, P. 2013, ApJ, 774, 123 [Google Scholar]
- Wedemeyer-Böhm, S., Scullion, E., Steiner, O., Rouppe van der Voort, L., et al. 2012, Nature, 486, 505 [Google Scholar]
- Williamson, C. H. K. 1996, Annu. Rev. Fluid Mech., 28, 477 [NASA ADS] [CrossRef] [Google Scholar]
- Xiang, Y.-Y., Liu, Z., & Jin, Z.-Y. 2016, New Astron., 49, 8 [CrossRef] [Google Scholar]
- Yan, X.-L., Xue, Z.-K., Xiang, Y.-Y., & Yang, L.-H. 2015, RAA, 15, 1725 [Google Scholar]
- Yang, H., Xu, Z., Lim, E.-K., et al. 2018, ApJ, 857, 115 [Google Scholar]
- Zhang, J., & Liu, Y. 2011, ApJ, 741, L7 [Google Scholar]
- Zhang, Q. M., Li, T., Zheng, R. S., Su, Y. N., & Ji, H. S. 2017, ApJ, 842, 27 [CrossRef] [Google Scholar]
- Zhang, X. F., Zhou, G. P., Jin, C. L., et al. 2024, A&A, 690, A134 [NASA ADS] [CrossRef] [EDP Sciences] [Google Scholar]
- Zirker, J. B., Engvold, O., & Martin, S. F. 1998, Nature, 396, 440 [Google Scholar]
All Figures
|
Fig. 1. Multi-wavelength observations showing the locations of the filament (case 1) and the prominence (case 2) where the vortices occurred. The left four panels, (a1)–(a2) and (b1)–(b2), show case 1. Panels (a1) and (b1): GONG Hα image and AIA 171 Å image showing the location of the filament. The green rectangle in panel (a1) outlines the FOV of panel (a2), the Hα image from the NVST. The green rectangle in panel (b1) outlines the FOV of panel (b2), the 171 Å image from the SDO/AIA. The red rectangles in panels (a2) and (b2) outline the FOV of Figs. 2(a1)–(a4) and 2(d1)–(d3). The right four panels, (c1)–(c2) and (d1)–(d2), show case 2. Panels (c1) and (d1): GONG Hα image and AIA 193 Å image showing the location of the prominence. The green rectangle in panel (c1) outlines the FOV of panel (c2), the Hα image from the NVST. The green rectangle in panel (d1) outlines the FOV of panel (d2), the 193 Å image from the SDO/AIA. The cyan rectangles in panels (c2) and (d2) outline the FOV of Figs. 3(a1)–(a4), 3(d1)–(d3), 4, 5(a1)–(a4) and 5(b1)–(b3). |
| In the text | |
|
Fig. 2. Temporal evolution of the clockwise vortex that appeared within the spine of the filament (case 1) on 3 June 2023. Panels (a1)–(a4): Vortex observed by the NVST Hα images. The yellow arrows in panels (a1)–(a4) indicate the velocity fields of the vortex based on the DAVE technique. The cyan arrows in panels (a2) and (a3) indicate the speeds of features E1 and E2 from the DAVE technique, respectively. Panels (b1)–(b2): Hα images displaying temporal evolutions of E1 in panel (a2). The positions of E1 at two moments are marked with magenta and cyan symbols “×”, respectively. Cyan arrows indicate the evolution orientations. Panels (c1)–(c2): Similar to panels (b1)–(b2), but for E2 in panel (a3). Panels (d1)–(d3): AIA 171 Å images. The red arrows in panels (d1)–(d3) indicate the velocity fields. Panel (e): Average projection speeds with error bars of the vortex from the NVST Hα observations (panels (a1)–(a4)) and the AIA 171 Å data (panels (d1)–(d3)). An animation of NVST Hα observations from 3 June 2023 at 02:05:48 UT to 03:00:15 UT, showing the evolution of the vortex, is available online. The real-time duration of this animation is 8 s. |
| In the text | |
|
Fig. 3. Temporal evolution of the counterclockwise single vortex that appeared in the prominence (case 2) at the northern limb of the solar disc on 6 September 2023. Panels (a1)–(a4): NVST Hα images. The yellow arrows in panels (a1)–(a4) indicate the velocity fields of the vortex. The cyan arrows in panels (a2) and (a4) indicate the speeds of features E3 and E4 from the DAVE technique, respectively. Panels (b1)–(b2): Hα images displaying temporal evolutions of E3 in panel (a2). The positions of E3 at two moments are marked with magenta and cyan symbols “×”, respectively. Cyan arrows indicate the evolution orientations. Panels (c1)–(c2): similar to panels (b1)–(b2), but for E4 in panel (a4). Panels (d1)–(d3): AIA 193 Å images. The blue arrows in panels (d1)–(d3) indicate the velocity fields. Panel (e): Average projection speeds with error bars of the vortex from the NVST Hα observations (panels (a1)–(a4)) and the AIA 193 Å data (panels (d1)–(d3)). An animation of NVST Hα observations from 6 September 2023 at 01:27:14 UT to 02:04:27 UT, showing the evolution of the single vortex before the split, is available online. The real-time duration of this animation is 5 s. |
| In the text | |
|
Fig. 4. Dynamic characteristics from single-vortex stage to three-vortex one in case 2. Panels (a1)–(a4): Plumes 1–3 are pointed out by the cyan, red, and green arrows, respectively. The yellow arrows in panel (a2) indicate the velocity fields of the single vortex. Panels (b1)–(b4): Bright upflow is pointed out by magenta arrows. The yellow arrows in panel (b3) indicate the velocity fields of the three vortices. An animation of NVST Hα observations from 6 September 2023 at 01:42:24 UT to 02:29:56 UT, showing the evolutions of the plumes, the bright upflow and the single vortex splitting into three vortices, is available online. The real-time duration of this animation is 6 s. |
| In the text | |
|
Fig. 5. Temporal evolution of the three vortices in case 2. Panels (a1)–(a4): NVST Hα images. The yellow arrows in panels (a1)–(a4) indicate the velocity fields of the vortices. In panel (a2), the combination part of the three vortices is pointed by the cyan arrow. Panels (b1)–(b3): AIA 193 Å images. The blue arrows in panels (b1)–(b3) indicate the velocity fields. Panel (c): Average projection speeds with error bars of the vortices from the NVST Hα observations (panels (a1)–(a4)) and the AIA 193 Å data (panels (b1)–(b3)). |
| In the text | |
Current usage metrics show cumulative count of Article Views (full-text article views including HTML views, PDF and ePub downloads, according to the available data) and Abstracts Views on Vision4Press platform.
Data correspond to usage on the plateform after 2015. The current usage metrics is available 48-96 hours after online publication and is updated daily on week days.
Initial download of the metrics may take a while.