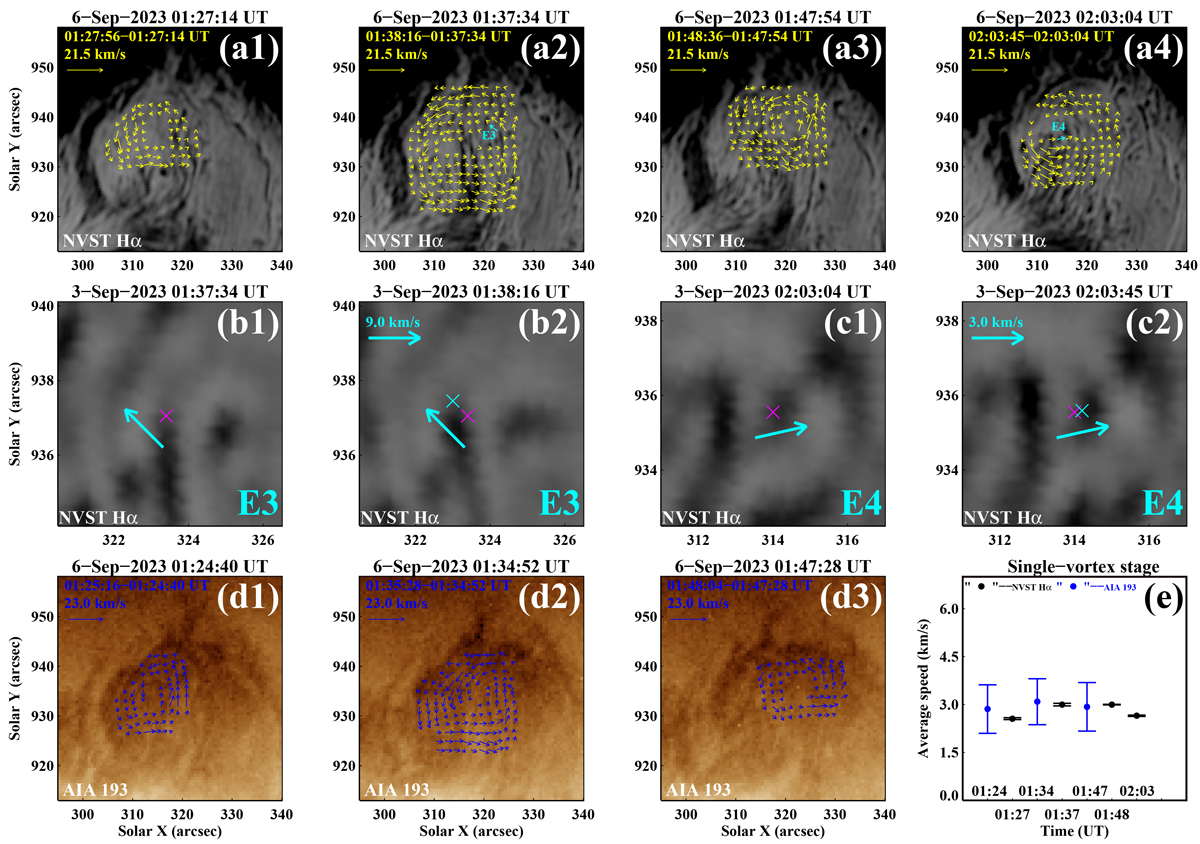
Fig. 3.
Download original image
Temporal evolution of the counterclockwise single vortex that appeared in the prominence (case 2) at the northern limb of the solar disc on 6 September 2023. Panels (a1)–(a4): NVST Hα images. The yellow arrows in panels (a1)–(a4) indicate the velocity fields of the vortex. The cyan arrows in panels (a2) and (a4) indicate the speeds of features E3 and E4 from the DAVE technique, respectively. Panels (b1)–(b2): Hα images displaying temporal evolutions of E3 in panel (a2). The positions of E3 at two moments are marked with magenta and cyan symbols “×”, respectively. Cyan arrows indicate the evolution orientations. Panels (c1)–(c2): similar to panels (b1)–(b2), but for E4 in panel (a4). Panels (d1)–(d3): AIA 193 Å images. The blue arrows in panels (d1)–(d3) indicate the velocity fields. Panel (e): Average projection speeds with error bars of the vortex from the NVST Hα observations (panels (a1)–(a4)) and the AIA 193 Å data (panels (d1)–(d3)). An animation of NVST Hα observations from 6 September 2023 at 01:27:14 UT to 02:04:27 UT, showing the evolution of the single vortex before the split, is available online. The real-time duration of this animation is 5 s.
Current usage metrics show cumulative count of Article Views (full-text article views including HTML views, PDF and ePub downloads, according to the available data) and Abstracts Views on Vision4Press platform.
Data correspond to usage on the plateform after 2015. The current usage metrics is available 48-96 hours after online publication and is updated daily on week days.
Initial download of the metrics may take a while.