Fig. 1.
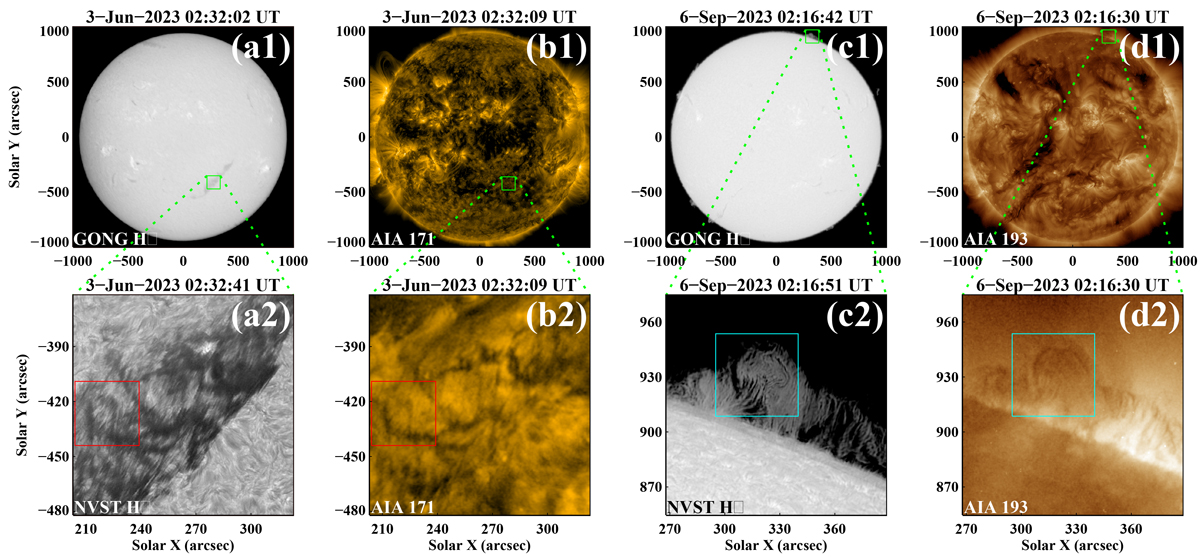
Download original image
Multi-wavelength observations showing the locations of the filament (case 1) and the prominence (case 2) where the vortices occurred. The left four panels, (a1)–(a2) and (b1)–(b2), show case 1. Panels (a1) and (b1): GONG Hα image and AIA 171 Å image showing the location of the filament. The green rectangle in panel (a1) outlines the FOV of panel (a2), the Hα image from the NVST. The green rectangle in panel (b1) outlines the FOV of panel (b2), the 171 Å image from the SDO/AIA. The red rectangles in panels (a2) and (b2) outline the FOV of Figs. 2(a1)–(a4) and 2(d1)–(d3). The right four panels, (c1)–(c2) and (d1)–(d2), show case 2. Panels (c1) and (d1): GONG Hα image and AIA 193 Å image showing the location of the prominence. The green rectangle in panel (c1) outlines the FOV of panel (c2), the Hα image from the NVST. The green rectangle in panel (d1) outlines the FOV of panel (d2), the 193 Å image from the SDO/AIA. The cyan rectangles in panels (c2) and (d2) outline the FOV of Figs. 3(a1)–(a4), 3(d1)–(d3), 4, 5(a1)–(a4) and 5(b1)–(b3).
Current usage metrics show cumulative count of Article Views (full-text article views including HTML views, PDF and ePub downloads, according to the available data) and Abstracts Views on Vision4Press platform.
Data correspond to usage on the plateform after 2015. The current usage metrics is available 48-96 hours after online publication and is updated daily on week days.
Initial download of the metrics may take a while.