Fig. 5.
Download original image
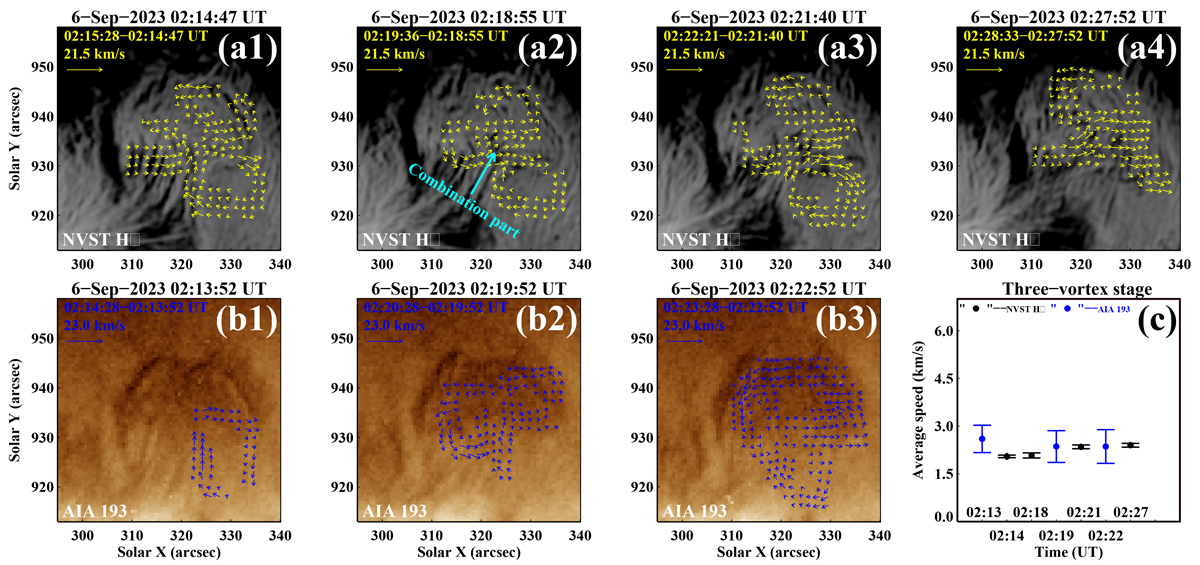
Temporal evolution of the three vortices in case 2. Panels (a1)–(a4): NVST Hα images. The yellow arrows in panels (a1)–(a4) indicate the velocity fields of the vortices. In panel (a2), the combination part of the three vortices is pointed by the cyan arrow. Panels (b1)–(b3): AIA 193 Å images. The blue arrows in panels (b1)–(b3) indicate the velocity fields. Panel (c): Average projection speeds with error bars of the vortices from the NVST Hα observations (panels (a1)–(a4)) and the AIA 193 Å data (panels (b1)–(b3)).
Current usage metrics show cumulative count of Article Views (full-text article views including HTML views, PDF and ePub downloads, according to the available data) and Abstracts Views on Vision4Press platform.
Data correspond to usage on the plateform after 2015. The current usage metrics is available 48-96 hours after online publication and is updated daily on week days.
Initial download of the metrics may take a while.