Fig. 6
Download original image
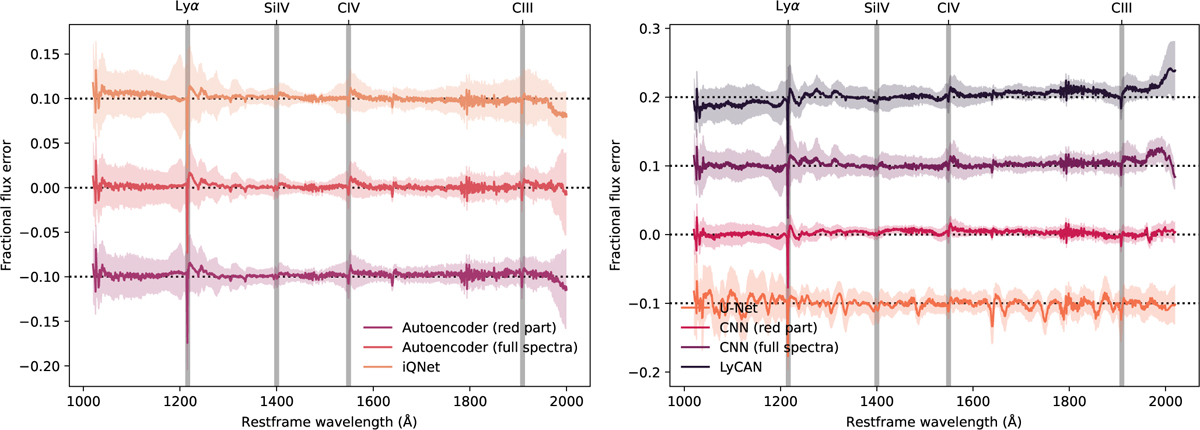
Performance of NN predictions with wavelength: Median fractional flux error (FFE) as a function of the wavelength for the autoencoders (left panel) and CNN (right panel). The shaded area shows the 16th and 84th percentiles of the distribution of the whole sample. The vertical shift is introduced to improve visualization. The black dotted lines show the zero point of each run. The shaded black vertical lines show the positions of the main emission lines in the wavelength range.
Current usage metrics show cumulative count of Article Views (full-text article views including HTML views, PDF and ePub downloads, according to the available data) and Abstracts Views on Vision4Press platform.
Data correspond to usage on the plateform after 2015. The current usage metrics is available 48-96 hours after online publication and is updated daily on week days.
Initial download of the metrics may take a while.