Fig. 2
Download original image
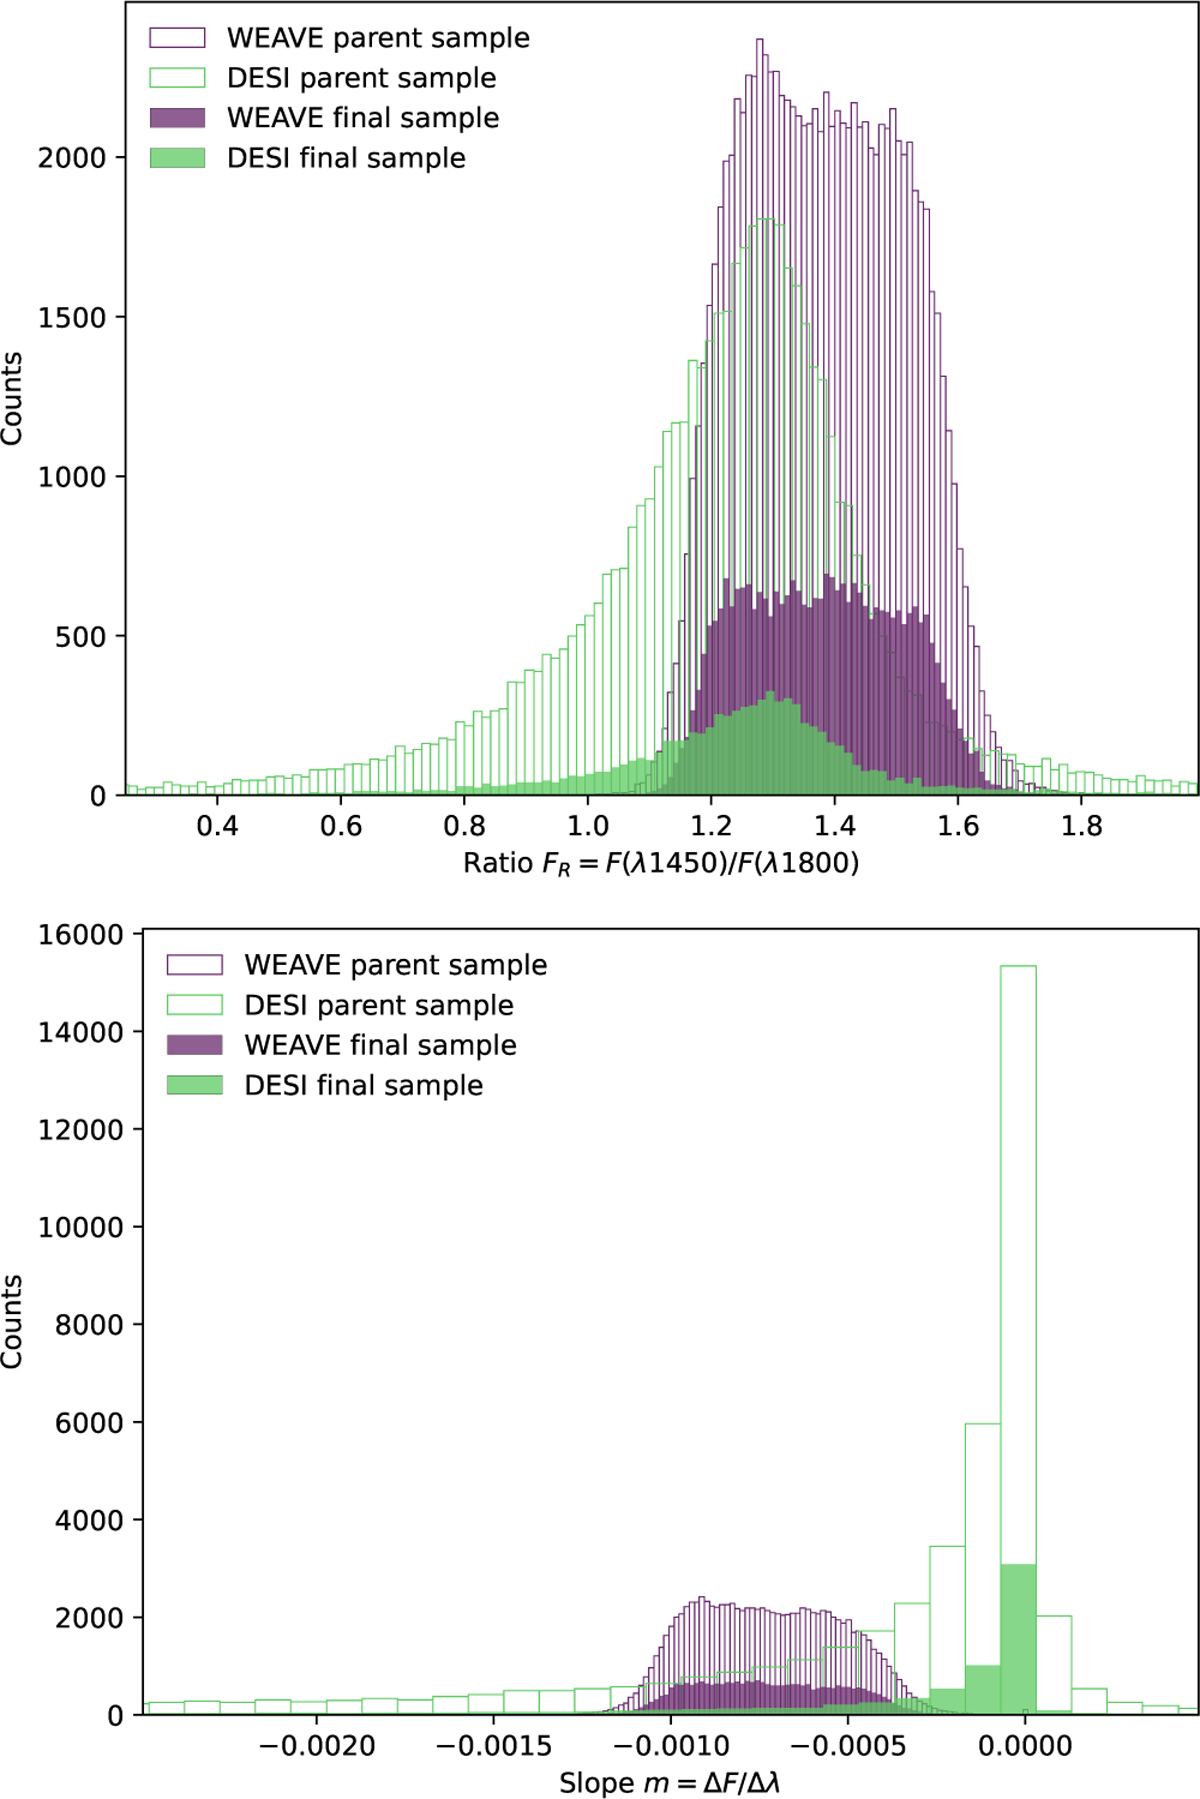
Histograms of the ratio (top) and slope (bottom) of the quasar spectra between the rest frame wavelengths λ = 1800 Å and λ = 1450 Å for the WEAVE mock catalog (purple) and the DESI EDR (green). The unfilled histograms show the distributions of the parent samples, while the filled histograms show the distributions of the final samples after all the data selections.
Current usage metrics show cumulative count of Article Views (full-text article views including HTML views, PDF and ePub downloads, according to the available data) and Abstracts Views on Vision4Press platform.
Data correspond to usage on the plateform after 2015. The current usage metrics is available 48-96 hours after online publication and is updated daily on week days.
Initial download of the metrics may take a while.