Fig. 11
Download original image
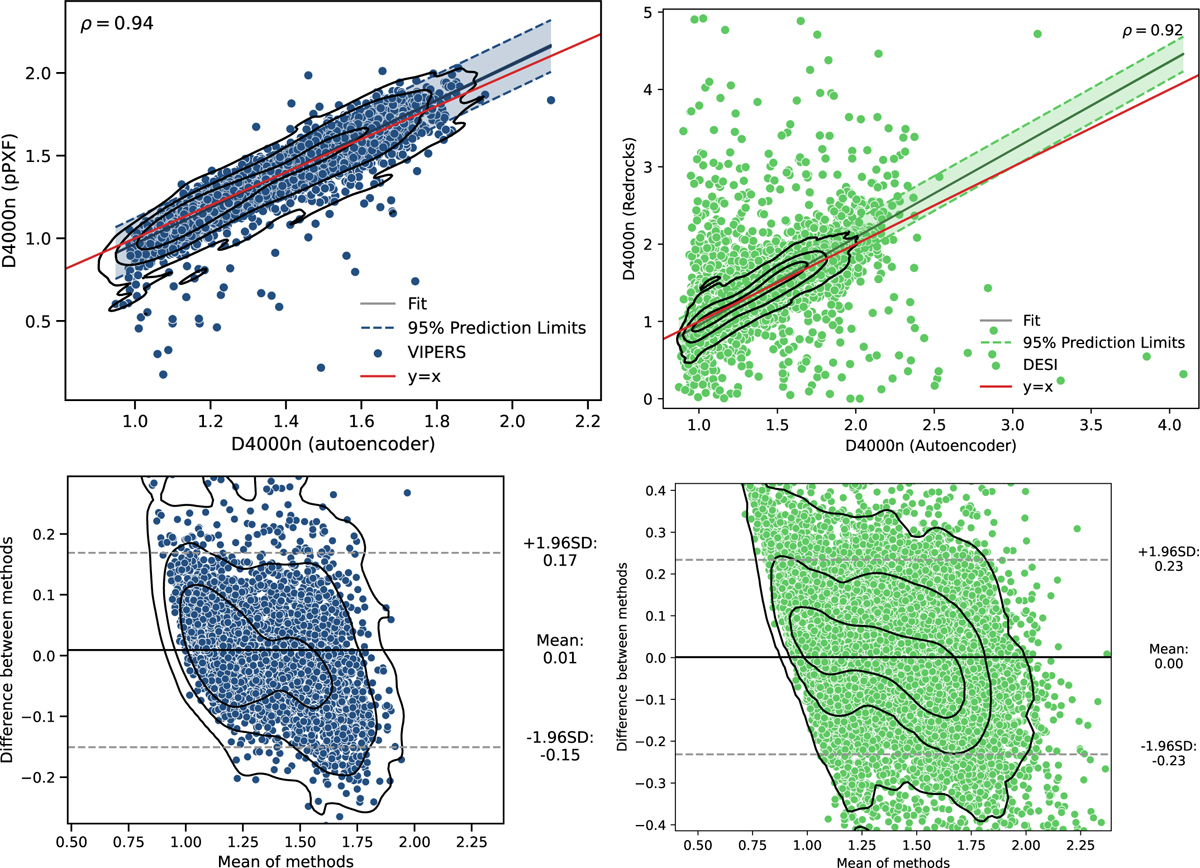
Comparison of the D4000n values estimated with the NN in this work and with pPXF (Pistis et al. 2024) (left panel) for VIPERS (in blue) and with Redrock (right panel) for DESI (in green). The red solid line shows the line y = x, the light-shaded area limited by dashed lines shows 95% prediction limits, and the dark-shaded area shows the 95% confidence limits. The density plots show the one-, two-, and three-sigma levels of the 2D distributions. Top panel: Direct comparison of the two methods. Bottom panel: Bland-Altman plot.
Current usage metrics show cumulative count of Article Views (full-text article views including HTML views, PDF and ePub downloads, according to the available data) and Abstracts Views on Vision4Press platform.
Data correspond to usage on the plateform after 2015. The current usage metrics is available 48-96 hours after online publication and is updated daily on week days.
Initial download of the metrics may take a while.