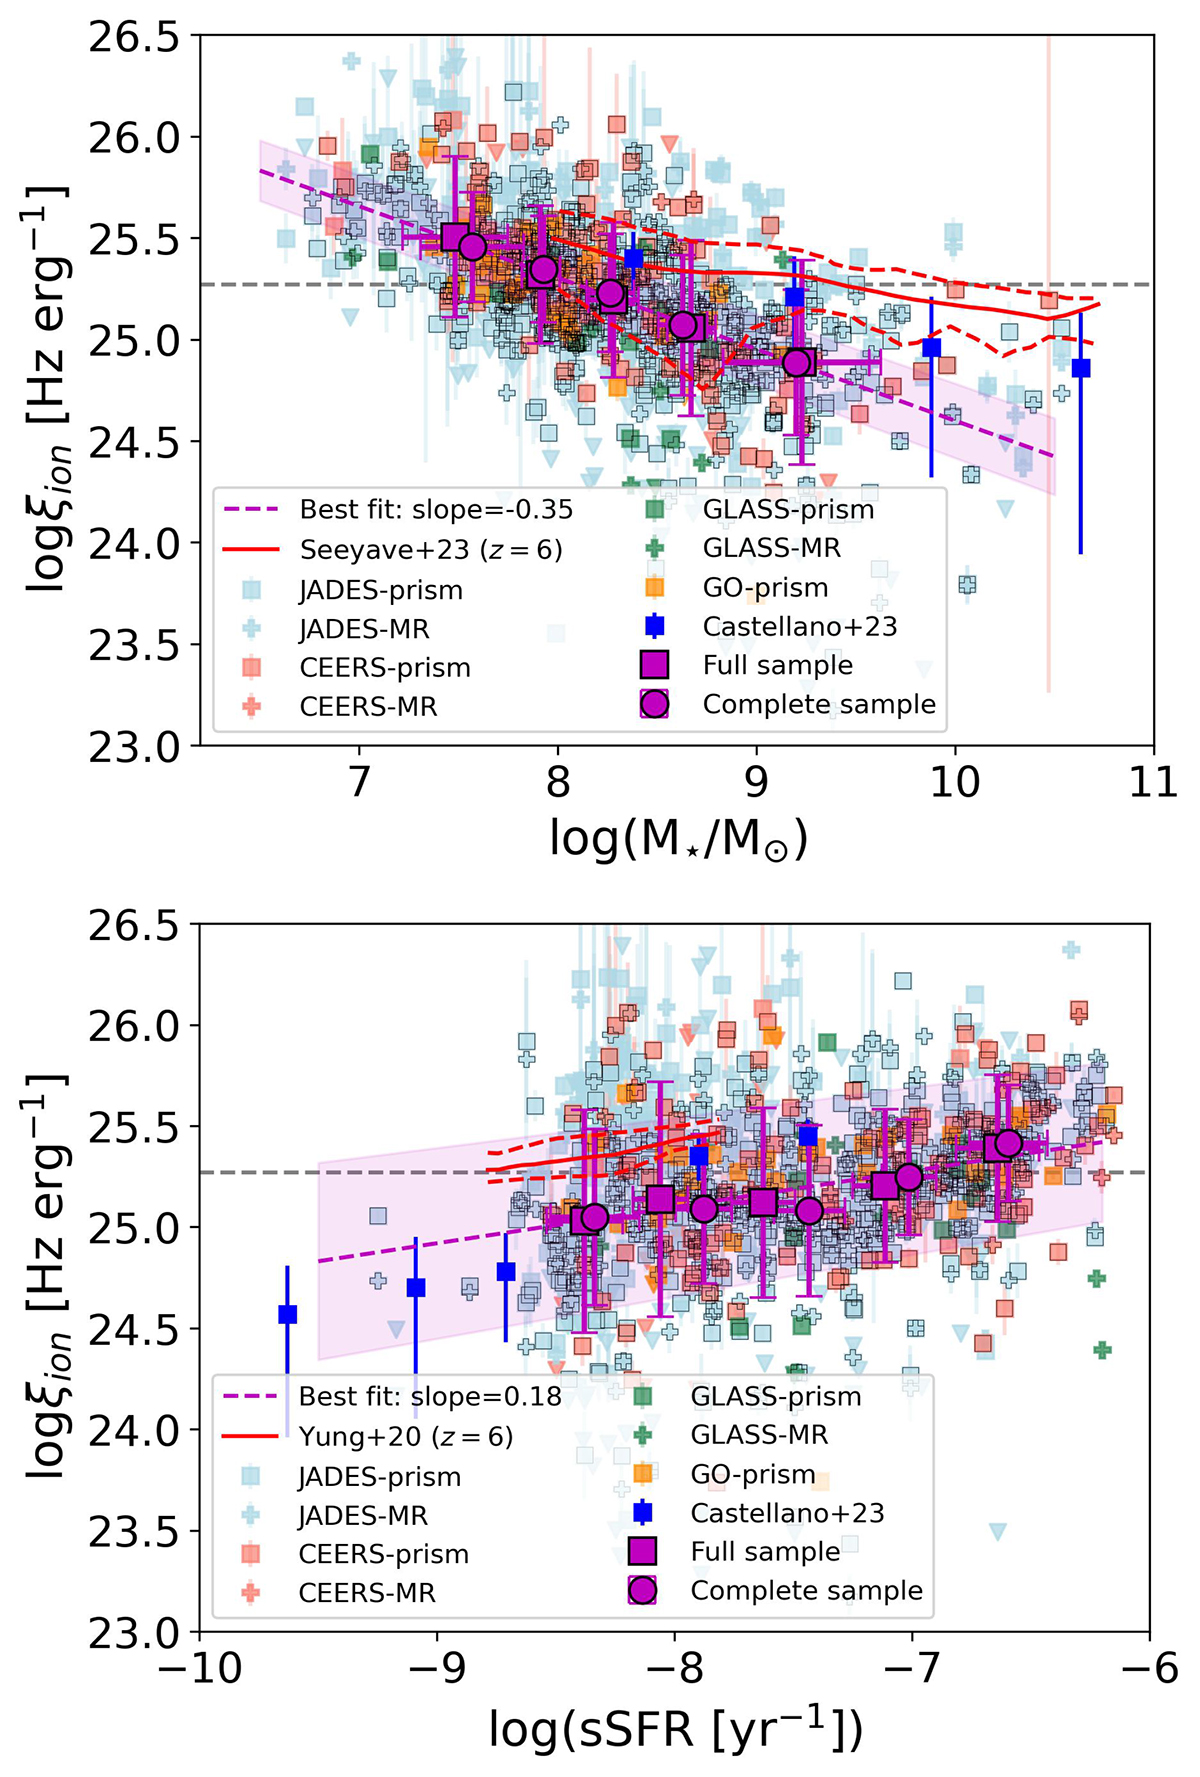
Fig. 8.
Download original image
Relation of ξion with physical properties of the galaxies. The top panel indicates the relation between ξion and stellar mass, while the bottom panel indicates the relation between ξion and the specific star-formation rate. The symbols are the same as in Fig. 4. In the top panel, the solid red line indicates the trend from the FLARES simulation at z = 6 (Seeyave et al. 2023), and the dashed red lines indicate their 3σ scatter. In the bottom panel, the solid red line represents the trend from the simulations in Yung et al. (2020b) at z = 6. The dashed red lines are the 16th and 84th percentiles.
Current usage metrics show cumulative count of Article Views (full-text article views including HTML views, PDF and ePub downloads, according to the available data) and Abstracts Views on Vision4Press platform.
Data correspond to usage on the plateform after 2015. The current usage metrics is available 48-96 hours after online publication and is updated daily on week days.
Initial download of the metrics may take a while.