Fig. 4.
Download original image
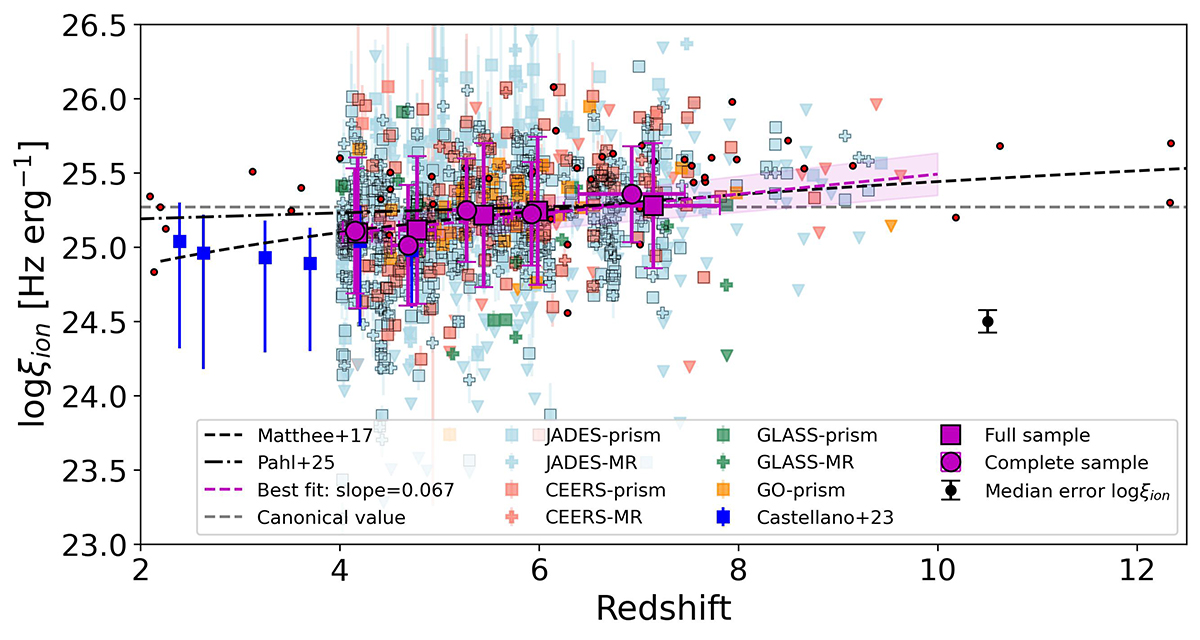
Redshift evolution of ξion for the entire sample. The individual galaxies are in red, light-blue, green, and orange symbols, depending on the parent survey. The symbols with black edges are galaxies in the complete sample. The plus symbols are galaxies based on the grating (MR) configuration, while the square symbols are galaxies observed with the prism configuration. The triangle symbols are upper limits. The magenta symbols are the median values of ξion in equally populated bins of redshift. The magenta squares are the median values considering the full sample, while the magenta circles are the median values considering only the complete sample. The blue symbols are average values from Castellano et al. (2023). The red circles are individual galaxies or stacks from literature (Stark et al. 2015; Nakajima et al. 2016; Mármol-Queraltó et al. 2016; Bouwens et al. 2016; Matthee et al. 2017; Stark et al. 2017; Shivaei et al. 2018; Harikane et al. 2018; Vanzella et al. 2018; Faisst et al. 2019; Lam et al. 2019; De Barros et al. 2019; Emami et al. 2020; Nanayakkara et al. 2020; Castellano et al. 2022; Marques-Chaves et al. 2022; Stefanon et al. 2022; Prieto-Lyon et al. 2023; Bunker et al. 2023; Rinaldi et al. 2024; Roberts-Borsani et al. 2024; Mascia et al. 2024a; Saxena et al. 2024; Lin et al. 2024; Álvarez-Márquez et al. 2024; Hsiao et al. 2024; Calabrò et al. 2024a; Vanzella et al. 2024; Zavala et al. 2025). The dashed magenta line is the best fit of the median values of the full sample. The dashed line is the relation from Matthee et al. (2017), and the dotted-dashed line is the relation from Pahl et al. (2025). The canonical value of log ξion[Hz erg−1] ≈ 25.27, often assumed in reionization models, is highlighted in a horizontal dashed gray line for reference. The black symbol represents the median error of 0.07 dex in log ξion.
Current usage metrics show cumulative count of Article Views (full-text article views including HTML views, PDF and ePub downloads, according to the available data) and Abstracts Views on Vision4Press platform.
Data correspond to usage on the plateform after 2015. The current usage metrics is available 48-96 hours after online publication and is updated daily on week days.
Initial download of the metrics may take a while.