| Issue |
A&A
Volume 698, May 2025
|
|
|---|---|---|
| Article Number | A160 | |
| Number of page(s) | 7 | |
| Section | Extragalactic astronomy | |
| DOI | https://doi.org/10.1051/0004-6361/202453046 | |
| Published online | 11 June 2025 | |
Accretion and ejection at work in the Narrow Line Seyfert 1 galaxy 1H 0323+342
A case of intermittent activity?
1
Department of Physics and Astronomy, University of Padova, vicolo dell’Osservatorio 3, 35122 Padova, Italy
2
Brera Astronomical Observatory, National Institute of Astrophysics (INAF), via Bianchi 46, 23807 Merate, Italy
⋆ Corresponding author.
Received:
18
November
2024
Accepted:
25
March
2025
Context. We present a comprehensive investigation into the properties of 1H 0323+342, a prominent jetted narrow-line Seyfert 1 galaxy.
Aims. The primary objective is to understand the interplay between the relativistic jet, the hot corona, and the accretion disk around the supermassive black hole.
Methods. This study spans the years 2006 to 2023, incorporating a rich dataset with 172 Swift observations, including the optical, UV, and X-ray bands, integrated with Fermi Large Area Telescope (LAT) observations. Spectral analysis was conducted on the X-ray observations using the XSPEC software, and the results were compared with optical, UV, and γ-ray flux measurements and photon index values.
Results. Our key findings include the identification of three distinct zones in the X-ray photon index-flux plot, characterized by high flux and a hard photon index (zone 1), high flux and a soft photon index (zone 2), and low flux and a soft photon index (zone 3). Before ∼2017, 1H 0323 + 342 moved back and forth between zones 1 and 2; after that epoch, it transitioned to zones 2 and 3. Correspondingly, we observed a decreasing jet activity in the Fermi/LAT data and a reduction in the accretion rate in optical/UV data from Swift/UVOT.
Conclusions. We interpret these observations in the framework of an intermittent jet scenario, driven by radiation-pressure instability in the accretion disk.
Key words: radiation mechanisms: non-thermal / techniques: spectroscopic / surveys / galaxies: jets / galaxies: Seyfert
© The Authors 2025
 Open Access article, published by EDP Sciences, under the terms of the Creative Commons Attribution License (https://creativecommons.org/licenses/by/4.0), which permits unrestricted use, distribution, and reproduction in any medium, provided the original work is properly cited.
This article is published in open access under the Subscribe to Open model. Subscribe to A&A to support open access publication.
1. Introduction
Narrow-line Seyfert 1 galaxies (NLS1) are a distinct subset of active galactic nuclei (AGNs) that exhibit unique optical features, including broad Balmer lines with full widths at half maximum ≲2000 km s−1, weak [OIII] emission lines with a flux ratio of [OIII] to Hβ < 3, and strong Fe II bumps (Osterbrock & Pogge 1985; Goodrich 1989).
In addition to these optical properties, NLS1s exhibit bright X-ray emission with steeper spectra compared to their broad-line counterparts (Leighly 1999). These galaxies typically host supermassive black holes with relatively low masses, ranging from 106 to 108 M⊙ (Peterson 2011; Peterson & Dalla Bontà 2018), and accrete close to the Eddington limit. This suggests they are young AGNs that may evolve into more luminous quasars (Grupe & Mathur 2004).
The discovery of high-energy γ-ray emission from NLS1s with the Fermi Large Area Telescope (LAT) in 2008 renewed interest in this class of AGNs (Abdo et al. 2009b); see also Foschini (2012, 2020) for comprehensive reviews.
1H 0323+342 is the closest γ-ray-emitting NLS1 (z = 0.063). Initially classified as a Seyfert 1 galaxy in the HEAO-1 X-ray survey, it showed strong Fe II lines and weak forbidden lines (Wood et al. 1984; Remillard et al. 1993). Subsequent observations, particularly in the radio band, revealed its hybrid nature, making it a prototype for a new class of AGNs that share characteristics of both NLS1s and blazars (Zhou et al. 2007).
Fermi/LAT observations confirmed the presence of a relativistic jet, which contributes to the nonthermal emission observed across its broadband spectral energy distribution (SED). The SED shows two distinct peaks in the radio-infrared and GeV γ-ray bands, along with variations in the X-ray emission, all of which indicates a complex interplay between the emission components (Abdo et al. 2009b).
Given its proximity to Earth, 1H 0323+342 is an ideal target for detailed study, allowing exploration across a broad range of wavelengths with higher angular resolution. Over the past decade, various observational campaigns have been conducted at radio frequencies (Wajima et al. 2014; Fuhrmann et al. 2016; Doi et al. 2018, 2020; Hada et al. 2018), optical wavelengths (Itoh et al. 2014; León Tavares et al. 2014; Wang et al. 2016, 2017; Olguín-Iglesias et al. 2020; Turner et al. 2022), X-rays (Yao et al. 2015; Ghosh et al. 2018; Berton et al. 2019; Mundo et al. 2020), and in multiwavelength studies (Tibolla et al. 2013; Paliya et al. 2014; Landt et al. 2017; Yao & Komossa 2023; Luashvili et al. 2023).
A summary of the physical properties of 1H 0323+342 is presented in Foschini et al. (2019). Notably, the X-ray spectrum of 1H 0323+342 is generally dominated by a power law with Γ ∼ 2.2, likely due to the thermal Comptonization of the hot corona surrounding the accretion disk. Occasionally, however, a harder component (Γ ∼ 1.4) emerges at a few keV (see, in particular the left panel in Fig. 1, in Foschini 2012), which suggests enhanced activity in the relativistic jet (Foschini et al. 2009; Foschini 2012; Tibolla et al. 2013; Paliya et al. 2014). Therefore, 1H 0323+342 provides an ideal case study for examining the interplay between the accretion disk and the relativistic jet. To this end, we (re)analyzed all available Swift observations in the archive to further investigate this source’s properties.
2. Data analysis
Data from the Neil Gehrels Swift Observatory (Gehrels et al. 2004) were obtained from the High-Energy Astrophysics Science Archive Research Center (HEASARC1). All Swift observations within 10′ of the coordinates of 1H 0323+342 were selected, resulting in 173 observations. The dataset includes X-Ray Telescope (XRT; Burrows et al. 2005) and Ultra-Violet/Optical Telescope (UVOT; Roming et al. 2005) data collected from 2006 to 2023. One observation (ID: 03111698008, 2022 November 11) was excluded because it contained only window-timing data recorded during slew and settling.
Data reduction was performed using HEASOFT 6.31.1 with calibration files from CALDB (updated on 2024 May 13). Standard procedures with default parameters were applied, as described in “The Swift XRT Data Reduction Guide” (Version 1.2, April 2005). The X-ray spectra were rebinned to ensure a minimum of 20 counts per bin, allowing the use of χ2 statistics.
X-ray spectra were analyzed using the xspec software package. To study the accretion-ejection evolution, we applied simple models (power law and broken power law) absorbed by the Galactic column (tbabs model with NH = 1.17 × 1021 cm−2; HI4PI Collaboration 2016). Model selection was performed using an F-test, with the broken power law model adopted when the probability value was below 4.0 × 10⁻³. Eleven observations were best fitted by the broken power law model. Unabsorbed fluxes were computed using the cflux convolution model. In five cases (2015 December 3, 2018 September 13, 2019 October 18, 2022 August 27, and 2023 February 11), the inclusion of the cflux model resulted in insufficient counts for χ2 statistics. Therefore, χ2 statistics were employed only for model selection, and the C-statistic was used to determine flux values for these observations, applied to spectra without a minimum count threshold per bin. Unless explicitly stated otherwise, all reported fluxes are intrinsic. Confidence intervals (90%) for the fitted parameters were estimated using the error command. Features such as the narrow Fe Kα line, previously reported by Abdo et al. (2009b) and Paliya et al. (2014), were not modeled, as their analysis would require longer exposure times and lies beyond the scope of this work.
UVOT magnitudes were extracted from a circular region with a 5″ radius, while the background was measured from an annular region with inner and outer radii of 7″ and 30″, respectively. Extinction corrections were applied to the UVOT magnitudes using the visual absorption AV = 0.578 from the Galactic dust reddening map (Schlafly & Finkbeiner 2011), following the extinction laws of Cardelli et al. (1989). The corrected magnitudes were converted into flux densities using zero-point values provided by CALDB, and two-point spectral indices were computed as:
where νV = 5.56 × 10¹⁴ Hz, νU = 8.57 × 10¹⁴ Hz, νUVW1 = 1.16 × 10¹⁵ Hz, and νUVW2 = 1.48 × 10¹⁵ Hz. For each observation, the derived values include: X-ray fluxes, photon indices, UV and optical flux densities, as well as spectral indices. A complete set of results is provided in the Appendix.
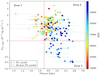 |
Fig. 1. Intrinsic X-ray flux in the 0.3–10 keV energy band as a function of the photon index. For observations modeled with a broken power law, the hard photon index and total flux are plotted. The vertical red line is set at a photon index of Γ ∼ 1.9, and the horizontal red line at a flux of F0.3 − 10 keV ∼ 10−11 erg cm−2 s−1. The plot is divided into three “zones”: zone 1 (top left) represents observations best modeled by a broken power law or a power law with a hard photon index; zone 2 (top right) includes observations modeled by power laws with softer photon indices and higher flux values; and zone 3 (bottom right) corresponds to observations modeled by power laws with soft photon indices and lower fluxes. The color gradient on the right represents the modified Julian date (MJD) of the observations, illustrating the temporal evolution of the source’s behavior. |
3. Results
Figure 1 presents the X-ray flux in the 0.3–10 keV energy band as a function of the photon index. The distribution of data points suggests setting two red lines at F0.3 − 10 keV ∼ 10−11 erg cm−2 s−1 and Γ ∼ 1.9. These lines divide the diagram into four “zones”:
-
Zone 1 (top left): Γ ≲ 1.9 & F0.3 − 10 keV ≳ 10−11 erg cm−2 s−1;
-
Zone 2 (top right): Γ ≳ 1.9 & F0.3 − 10 keV ≳ 10−11 erg cm−2 s−1;
-
Zone 3 (bottom right): Γ ≳ 1.9 & F0.3 − 10 keV ≲ 10−11 erg cm−2 s−1;
-
Zone 4 (bottom left): Γ ≲ 1.9 & F0.3 − 10 keV ≲ 10−11 erg cm−2 s−1, zone of avoidance, no X-ray data were found in this zone.
To categorize the observations into spectral states, we initially fitted all spectra with a simple power law model, identifying an average photon index of 1.9. This threshold (Γ ∼ 1.9) aligns with the typical photon index for unsaturated Comptonization (Rybicki & Lightman 1979), the process governing radiative emission in the corona of an accretion disk (e.g., Haardt & Maraschi 1991, 1993). As a result, we identify zones 2 and 3 as primarily dominated by coronal emission, whereas zone 1, which exhibits higher fluxes and harder photon indices, is likely dominated by relativistic jet emission.
Observations with a photon index below this threshold were categorized as belonging to zone 1. Following this initial classification, we refined the spectral fitting by selecting either a simple power law or a broken power law model, choosing the one that provided the best fit. For spectra best described by a broken power law, we used the hard photon index (corresponding to the high-energy component) for classification.
After classifying the three zones, we combined the spectra corresponding to each zone using the addspec tool, weighting each observation by its duration. Initially, individual spectra were not binned with a minimum count threshold. The co-added spectra were subsequently re-binned to ensure a minimum of 30 counts per bin. For zone 1, the broken power law model provided the best fit, whereas for zone 2, the addition of a broken power law component did not significantly improve the fit over a simple power law. Instead, including a zbbody component to model the soft excess improved the fit. For zone 3, the simple power law model was sufficient to describe the spectra. While more complex components, particularly in the soft X-ray band, could further refine the fits for zones 1 and 2, the main focus of this work is on the jet emission, which primarily contributes to the hard X-rays. The resulting spectral fits are summarized in Table 1.
Spectral fits of the co-added spectra for the three zones.
To investigate the contributions of the accretion disk and the jet, we examined observations at wavelengths where each component is expected to dominate. Previous SED studies suggest that the optical/UV emission primarily originates from the accretion disk (Abdo et al. 2009b; Foschini 2012).
Although the most significant variations occur in the X-ray band, our analysis of UVOT data also reveals variability in both flux and spectral index. To compare the three zones across different energy bands, we computed the average fluxes and spectral indices for each zone, as summarized in Table 2. Zones 1 and 2 have consistent values within the uncertainties, whereas zone 3 has lower fluxes and softer spectral indices. A complete list of results is provided in the Appendix.
Average spectral indexes, optical and UV fluxes for each zone.
Additionally, we constructed a SED for 1H 0323+342, shown in Fig. 2, covering all Swift frequency ranges. This confirms our earlier findings: while variations in UVOT frequencies are less pronounced than in XRT, zone 3 consistently exhibits lower flux levels.
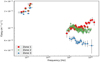 |
Fig. 2. SED of Swift observations of 1H0323+342. Left: UVOT data. Right: XRT data. The plot shows unabsorbed flux (erg cm−2 s−1) on a logarithmic scale as a function of frequency (Hz), with the three distinct zones indicated: zone 1 as red squares, zone 2 as green stars, and zone 3 as blue triangles. |
Jet emission dominates the high-energy γ-ray band, requiring data from Fermi/LAT. The Fermi LAT Light Curve Repository (LCR2, Abdollahi et al. 2023) provides publicly available light curves in the 0.1 − 100 GeV band, at intervals of 3 days, 1 week, and 1 month, with fixed or free photon index. We retrieved the light curve of 1H 0323+342 by selecting three-day time bin and free Γ. We considered only values with likelihood test statistic TS ≳ 10, equivalent to ≳3σ detection (Mattox et al. 1996). Data are shown in the top panels of Figs. 3 and 4.
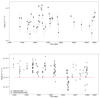 |
Fig. 3. Top panel: Fermi/LAT light curve in the 0.1 − 100 GeV energy range, with a clear absence of detections beginning around 2017 September 4 (MJD 58000). Bottom panel: Swift/XRT light curve in the 0.3 − 10 keV energy band, with the dashed red line set at flux, F0.3 − 10 keV ∼ 10−11 erg cm−2 s−1. We see a decrease in flux values starting from 2017 (MJD 57500-58000). |
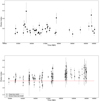 |
Fig. 4. Top panel: Evolution of the Fermi/LAT photon index from 2007 to 2024 (∼MJDs 54000-60600). Bottom panel: Changes in the photon index in the same time period with the dashed red line set at photon index Γ = 1.9. |
We compared the Fermi/LAT curves (Fig. 3) with the Swift/XRT ones. We noted that the lack of γ-ray detection corresponds to a lower X-ray flux, and steeper spectra. Interestingly, these data refer to the zone 3.
In summary, significant jet activity was observed between 2006 and 2017, as indicated by the X-ray data fluctuating between zones 1 and 2, accompanied by prominent high-energy γ-ray emission, including a notable outburst in 2013 (Carpenter & Ojha 2013; Paliya et al. 2014, 2015). As shown in Figure 5, the data points move between zone 1 and zone 2 during the jet activity, illustrating the spectral evolution associated with the γ-ray outburst. This transition provides insights into the interplay between the relativistic jet and the corona, with higher flux states accompanied by spectral hardening, a characteristic signature of jet-dominated emission.
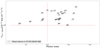 |
Fig. 5. Photon index vs. 0.3 − 10 keV flux before and during the first 2013 γ-ray outburst. Observations span from 2011 May 19 (MJD 55700) to 2013 July 27 (MJD 56500), with numbers indicating the chronological sequence. The movement of data points between zone 1 and zone 2 highlights the evolution of the X-ray spectral state during jet activity. |
Following 2017, the source shifted to zone 3, marked by lower X-ray flux and steeper spectra, although occasional flux increases were detected, consistently associated with soft photon indices (i.e., the source alternated between zones 3 and 2). A similar trend was observed in the optical/UV bands, and γ-ray detections became progressively less frequent.
4. Discussion
Being the closest NLS1, 1H 0323+342 is a bright source with strong X-ray emission, extensively observed by various satellites, particularly after the discovery of high-energy γ-ray emission from its relativistic jet. This makes it an excellent target for investigating jet-disk coupling and emission mechanisms. Many studies have focused on the corona, the potential soft excess, the Fe Kα emission line, the spin of the central black hole, and SED modeling (e.g., Yao et al. 2015; Kynoch et al. 2018; Ghosh et al. 2018; Mundo et al. 2020; Luashvili et al. 2023).
For example, Luashvili et al. (2023) modeled different states of 1H 0323+342 between 2008 and 2015, but their analysis did not include zone 3, which occurred after 2017. Their SED modeling confirms our findings, showing changes in jet emission primarily caused by variations in the electron distribution, while the surrounding photon field remained nearly constant. In their work, the source is observed moving back and forth between zones 1 and 2, consistent with our classification scheme.
In other studies, 1H 0323+342 has been analyzed as part of larger samples, with its X-ray spectral characteristics examined in a broader context (e.g., Walton et al. 2013; Paliya et al. 2015; Iso et al. 2016; Berton et al. 2019; Waddell & Gallo 2020; D’Ammando 2020). X-ray spectral variability has been widely reported, often showing spectral hardening during jet activity (Foschini et al. 2009; Foschini 2012; Tibolla et al. 2013; Paliya et al. 2014, 2015).
Swift monitoring over the past two decades has been particularly valuable due to the simultaneous availability of optical-to-X-ray data (e.g., Tibolla et al. 2013; Paliya et al. 2014, 2015; Yao et al. 2015; D’Ammando 2020). For instance, Yao & Komossa (2023) analyzed all Swift observations from 2006 to 2021 and identified a strong correlation between the αox parameter, defined as:
and the X-ray flux in the 0.3 − 2 keV and 2 − 10 keV bands. They observed that the broad-band spectrum becomes bluer during brightening episodes. Yao et al. (2015) attributed long-term UV/X-ray variability to the viscous timescale of an optically thick accretion disk (Czerny 2006), while short-term variability was linked to changes in the mass density and temperature of the X-ray corona. When the jet is inactive, it contributes less than ∼5% of the total optical-to-X-ray flux (Yao & Komossa 2023).
Our optical, UV, and X-ray data from Swift observations reveal three distinct zones of activity for 1H 0323+342, with a threshold X-ray flux of ∼10−11 erg cm−2 s−1 and a photon index of ∼1.9. The novelty of this work is the identification of zone 3. The optical and UV fluxes exhibit similar behavior within zones 1+2 and 3, although with smaller amplitude variations compared to the X-ray band. This is consistent with a minimal jet contribution in these bands, as inferred from the low polarization percentage (1–3%, Itoh et al. 2014). The jet activity observed in the X-ray band aligns with the γ-ray light curve from Fermi/LAT.
Fermi/LAT observations began in August 2008, but 1H 0323+342 was not detected during the first three months of operations (Abdo et al. 2009a). After one year, however, it was identified as one of three newly detected RL-NLS1 sources with a detection significance of approximately 5σ (Abdo et al. 2009b). Multiwavelength light curves from Paliya et al. (2014) also revealed a radio outburst at 15 GHz in 2009, following a period of low X-ray flux (∼10−12 erg cm−2 s−1) reported by Zhou et al. (2007), indicating near-inactive jet conditions before γ-ray detection.
Although more recent Swift data are unavailable, Fermi/LAT observations indicate renewed jet activity in recent months, following a period of inactivity lasting approximately 7–8 years. These observations align with the interpretation of intermittent jet activity driven by radiation-pressure instability in the accretion disk (Czerny et al. 2009).
According to Czerny et al. (2009), such instabilities occur in objects with high accretion rates, including NLS1s like 1H 0323+342, which are part of the same population as compact symmetric objects viewed at different angles (Berton et al. 2016). These instabilities require a dimensionless accretion rate ṁ ≳ 0.025, and the time interval between active phases is given by the equation:
![$$ \begin{aligned} \footnotesize \log T~[{y}] \sim 1.25 \log (\nu 1L_{\rm 5GHz}) - 0.38 \log \left(\frac{\alpha }{0.02}\right) + 1.25 \log K_{5} - 53.6. \end{aligned} $$](/articles/aa/full_html/2025/06/aa53046-24/aa53046-24-eq3.gif)
where L5GHz [erg s−1] is the monochromatic radio luminosity at 5 GHz, K5 is the bolometric correction factor at the same frequency, and α is the viscosity of the accretion disk.
For 1H 0323+342, we redefined the X-ray threshold flux by separating the contributions from the jet and the corona. Based on observations modeled with a broken power law, the soft component is attributed to the corona, while the hard component arises from the jet. Our analysis (see Table A.1.) indicates that the jet contributes between 20% and 77% of the total flux, with an average of 42%. Consequently, we attributed 58% of the threshold flux (∼5.8 × 10⁻¹² erg cm−2 s−1) to the corona. Using photon index value Γ = 1.9, we scaled this flux from the 0.3–10 keV band to the 2–10 keV band and estimate the bolometric luminosity following the Netzer (2019) law. The resulting 2–10 keV luminosity is ∼2.5 × 1043 erg s−1, with a bolometric correction factor K2−10 keV ∼ 18.4, yielding a bolometric luminosity of 4.6 × 1044 erg s−1. Given a black hole mass of ∼2 × 10⁷ M⊙ (Landt et al. 2017), the Eddington luminosity is 2.6 × 1045 erg s−1, resulting in a dimensionless accretion rate of:
which significantly exceeds the threshold for radiation-pressure instability (Czerny et al. 2009).
To calculate the recurrence time, we refer to the radio luminosity at 5 GHz. Angelakis et al. (2015) report a stable average radio flux of 0.4 Jy at 4.85 GHz during 2009–2014, with minimal variations during flares, where the Doppler factor reaches values up to 3 only. Therefore, assuming no significant Doppler boosting, the corresponding radio luminosity is ∼1.7 × 1041 erg s−1, with a bolometric correction factor log K5 ∼ 3.4. Substituting these values into Eq. (3), we estimate a recurrence time of ∼154 years.
However, as Czerny et al. (2009) noted, higher viscosity or accretion rates near the Eddington limit can reduce this timescale by an order of magnitude, consistent with the observed 7-8 year interval. The elevated magnetic field inferred from the SED model of Abdo et al. (2009b) suggests high viscosity, further supporting this adjustment.
While these calculations provide reasonable estimates, caution is warranted due to uncertainties, such as the limited temporal sampling, challenges in separating jet and corona contributions in the X-ray band, and assumptions about viscosity. Nonetheless, the theory of radiation-pressure instability remains a plausible explanation for the observed intermittent jet behavior, whilst requiring fine-tuning and detailed modeling. A targeted multiwavelength monitoring campaign could provide further insights into this phenomenon.
5. Comparison with the intensity-hardness plot of stellar-mass black holes
Peretz & Behar (2018) proposed a classification of AGNs based on their hardness variability, following a method commonly applied to stellar-mass black holes and X-ray binaries (XRBs). Their study identified four regions (see their Fig. 4): Q1 (hard objects that harden as they brighten), Q2 (hard objects that soften as they brighten), Q3 (soft objects that soften as they brighten), and Q4 (soft objects that harden as they brighten). Given the different selection of parameters, a direct comparison between our Figure 1 and the Q1-Q4 classification from Peretz & Behar (2018) is not straightforward. However, the overall distribution of data follows a “harder when brighter” trend, which aligns with Q4, as also found for 1H 0323+342 by Peretz & Behar (2018) based on mean values from their Table 2 (derived from Swift/XRT data). Their study did not capture zone 3, which only emerged after 2017.
To facilitate a direct comparison between Fig. 1 and the intensity-hardness plots commonly used for stellar-mass black holes (e.g., Dunn et al. 2010, Fig. 4; Motta et al. 2021, Fig. 1), we recalculated the fluxes and replaced the photon index with the hardness ratio. The result, shown in Fig. 6, reveals that while our zone plot exhibits a q-shaped structure similar to that seen in XRBs, it appears as a mirrored version.
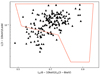 |
Fig. 6. Figure 1 redrawn as an intensity-hardness plot for comparison with XRBs. The dashed red line represents the envelope of XRB regions from Dunn et al. (2010, their Fig. 4) and Motta et al. (2021, their Fig. 1). |
In XRBs, spectral transitions occur between a low-hard state, associated with a radio jet and a truncated accretion disk, and a high-soft state, where the jet disappears and the disk extends inward (Remillard & McClintock 2006; Plotkin et al. 2013). In the case of 1H 0323+342, the source alternates between a high-hard state (zone 1), dominated by jet emission, and a high-soft state (zone 2), dominated by the corona. From this high-soft state, the source transitions to a low-soft state (zone 3), where X-ray emission originates solely from the corona.
In the XRB diagram of Dunn et al. (2010), the empty region corresponds to a low-soft state, where lower luminosities are linked exclusively to hard spectra. Conversely, in Fig. 6, the empty region corresponds to a low-hard state, while the lowest luminosities are associated only with soft spectra.
This difference arises because XRB intensity-hardness diagrams primarily reflect accretion disk behavior, whereas in AGNs, the X-ray band mainly probes the corona. The lower (UV) frequency peak of disk emission in AGNs, a result of the inverse relationship between disk temperature and black hole mass, contributes to this distinction. Additionally, in jetted AGNs, X-rays can include a significant jet component, such as synchrotron tail emission in BL Lacs or inverse-Compton scattering in quasars and NLS1s. 1H 0323+342 stands out due to its strong corona and intermittent jet activity.
As highlighted by Peretz & Behar (2018), comparing AGNs with XRBs helps identify common physical mechanisms and enhances our understanding of accretion and ejection processes across different mass scales. While AGNs and XRBs can exhibit similar accretion cycles, differences in emission components lead to distinct observational characteristics depending on the source type. In XRBs, jet activity is typically associated with low accretion states. In AGNs, however, the relationship between jet activity and accretion rate is more complex. This difference likely explains why Fig. 6 appears as a mirrored version of the standard XRB diagram.
6. Conclusion
We have conducted a comprehensive multiwavelength analysis of the jetted NLS1 1H 0323+342 to better understand the intricate mechanisms governing disk-corona-jet interactions. Our investigation included a detailed spectral analysis of X-ray data from Swift/XRT, photometric analysis of UV and optical data from Swift/UVOT, and temporal insights from a Fermi/LAT light curve.
We identified three distinct zones in the photon index-flux plot: zone 1, characterized by high fluxes and hard spectra and dominated by jet activity; zone 2, with high fluxes and softer spectra, indicating a weaker jet and a stronger corona; and zone 3, with lower fluxes and soft spectra, where the emission is likely driven solely by the corona. Observations before 2017 primarily show transitions between zones 1 and 2, while post-2017 data reveal transitions between zones 2 and 3, suggesting a cessation or significant weakening of jet activity during this period.
These findings provide strong evidence for intermittent jet activity driven by radiation-pressure instabilities in the accretion disk, consistent with the theoretical framework proposed by Czerny et al. (2009). The observed X-ray flux threshold of ∼10−11 erg cm−2 s−1 aligns with the accretion rate required to trigger such instabilities.
1H 0323+342 remains a valuable target for studying the interplay between accretion and ejection processes in AGNs. Continued long-term monitoring of this source is crucial for gaining further insights into its evolution.
Data availability
Tables A.1, B.1, C.1, D.1 are available at the CDS via anonymous ftp to cdsarc.cds.unistra.fr (130.79.128.5) or via https://cdsarc.cds.unistra.fr/viz-bin/cat/J/A+A/698/A160
References
- Abdo, A. A., Ackermann, M., Ajello, M., et al. 2009a, ApJ, 700, 597 [CrossRef] [Google Scholar]
- Abdo, A. A., Ackermann, M., Ajello, M., et al. 2009b, ApJ, 707, L142 [NASA ADS] [CrossRef] [Google Scholar]
- Abdollahi, S., Ajello, M., Baldini, L., et al. 2023, ApJS, 265, 31 [NASA ADS] [CrossRef] [Google Scholar]
- Angelakis, E., Fuhrmann, L., Marchili, N., et al. 2015, A&A, 575, A55 [NASA ADS] [CrossRef] [EDP Sciences] [Google Scholar]
- Berton, M., Caccianiga, A., Foschini, L., et al. 2016, A&A, 591, A98 [NASA ADS] [CrossRef] [EDP Sciences] [Google Scholar]
- Berton, M., Braito, V., Mathur, S., et al. 2019, A&A, 632, A120 [NASA ADS] [CrossRef] [EDP Sciences] [Google Scholar]
- Burrows, D. N., Hill, J. E., Nousek, J. A., et al. 2005, Space Sci. Rev., 120, 165 [Google Scholar]
- Cardelli, J. A., Clayton, G. C., & Mathis, J. S. 1989, ApJ, 345, 245 [Google Scholar]
- Carpenter, B., & Ojha, R. 2013, ATel, 5344, 1 [Google Scholar]
- Czerny, B. 2006, in AGN Variability from X-Rays to Radio Waves, eds. C. M. Gaskell, I. M. McHardy, B. M. Peterson, & S. G. Sergeev, ASP Conf. Ser., 360, 265 [NASA ADS] [Google Scholar]
- Czerny, B., Siemiginowska, A., Janiuk, A., Nikiel-Wroczyński, B., & Stawarz, Ł. 2009, ApJ, 698, 840 [NASA ADS] [CrossRef] [Google Scholar]
- D’Ammando, F. 2020, MNRAS, 496, 2213 [CrossRef] [Google Scholar]
- Doi, A., Hada, K., Kino, M., Wajima, K., & Nakahara, S. 2018, ApJ, 857, L6 [NASA ADS] [CrossRef] [Google Scholar]
- Doi, A., Kino, M., Kawakatu, N., & Hada, K. 2020, MNRAS, 496, 1757 [Google Scholar]
- Dunn, R. J. H., Fender, R. P., Körding, E. G., Belloni, T., & Cabanac, C. 2010, MNRAS, 403, 61 [Google Scholar]
- Foschini, L. 2012, in Proceedings of Nuclei of Seyfert galaxies and QSOs - Central engine& conditions of star formation (Seyfert 2012). 6-8 November, 10 [Google Scholar]
- Foschini, L. 2020, Universe, 6, 136 [NASA ADS] [CrossRef] [Google Scholar]
- Foschini, L., Maraschi, L., Tavecchio, F., et al. 2009, Adv. Space Res., 43, 889 [NASA ADS] [CrossRef] [Google Scholar]
- Foschini, L., Ciroi, S., Berton, M., et al. 2019, Universe, 5, 199 [NASA ADS] [CrossRef] [Google Scholar]
- Fuhrmann, L., Karamanavis, V., Komossa, S., et al. 2016, Res. Astron. Astrophys., 16, 176 [Google Scholar]
- Gehrels, N., Chincarini, G., Giommi, P., et al. 2004, ApJ, 611, 1005 [Google Scholar]
- Ghosh, R., Dewangan, G. C., Mallick, L., & Raychaudhuri, B. 2018, MNRAS, 479, 2464 [CrossRef] [Google Scholar]
- Goodrich, R. W. 1989, ApJ, 342, 224 [Google Scholar]
- Grupe, D., & Mathur, S. 2004, ApJ, 606, L41 [NASA ADS] [CrossRef] [Google Scholar]
- Haardt, F., & Maraschi, L. 1991, ApJ, 380, L51 [Google Scholar]
- Haardt, F., & Maraschi, L. 1993, ApJ, 413, 507 [Google Scholar]
- Hada, K., Doi, A., Wajima, K., et al. 2018, ApJ, 860, 141 [NASA ADS] [CrossRef] [Google Scholar]
- HI4PI Collaboration (Ben Bekhti, N., et al.) 2016, A&A, 594, A116 [NASA ADS] [CrossRef] [EDP Sciences] [Google Scholar]
- Iso, N., Ebisawa, K., Sameshima, H., et al. 2016, PASJ, 68, S27 [NASA ADS] [CrossRef] [Google Scholar]
- Itoh, R., Tanaka, Y. T., Akitaya, H., et al. 2014, PASJ, 66, 108 [Google Scholar]
- Kynoch, D., Landt, H., Ward, M. J., et al. 2018, MNRAS, 475, 404 [NASA ADS] [CrossRef] [Google Scholar]
- Landt, H., Ward, M. J., Baloković, M., et al. 2017, MNRAS, 464, 2565 [Google Scholar]
- Leighly, K. M. 1999, ApJS, 125, 317 [Google Scholar]
- León Tavares, J., Kotilainen, J., Chavushyan, V., et al. 2014, ApJ, 795, 58 [Google Scholar]
- Luashvili, A., Boisson, C., Zech, A., et al. 2023, MNRAS, 523, 404 [NASA ADS] [CrossRef] [Google Scholar]
- Mattox, J. R., Bertsch, D. L., Chiang, J., et al. 1996, ApJ, 461, 396 [Google Scholar]
- Motta, S., Rodriguez, J., Jourdain, E., et al. 2021, New Astron. Rev., 93, 101618 [CrossRef] [Google Scholar]
- Mundo, S. A., Kara, E., Cackett, E. M., et al. 2020, MNRAS, 496, 2922 [Google Scholar]
- Netzer, H. 2019, MNRAS, 488, 5185 [NASA ADS] [CrossRef] [Google Scholar]
- Olguín-Iglesias, A., Kotilainen, J., & Chavushyan, V. 2020, MNRAS, 492, 1450 [Google Scholar]
- Osterbrock, D. E., & Pogge, R. W. 1985, ApJ, 297, 166 [Google Scholar]
- Paliya, V. S., Sahayanathan, S., Parker, M. L., et al. 2014, ApJ, 789, 143 [Google Scholar]
- Paliya, V. S., Stalin, C. S., & Ravikumar, C. D. 2015, AJ, 149, 41 [Google Scholar]
- Peretz, U., & Behar, E. 2018, MNRAS, 481, 3563 [NASA ADS] [CrossRef] [Google Scholar]
- Peterson, B. M. 2011, in Narrow-Line Seyfert 1 Galaxies and their Place in the Universe, eds. L. Foschini, M. Colpi, L. Gallo, et al., 32 [Google Scholar]
- Peterson, B., & Dalla Bontà, E. 2018, in Revisiting Narrow-Line Seyfert 1 Galaxies and their Place in the Universe, 8 [Google Scholar]
- Plotkin, R. M., Gallo, E., & Jonker, P. G. 2013, ApJ, 773, 59 [NASA ADS] [CrossRef] [Google Scholar]
- Remillard, R. A., & McClintock, J. E. 2006, ARA&A, 44, 49 [Google Scholar]
- Remillard, R. A., Bradt, H. V. D., Brissenden, R. J. V., et al. 1993, AJ, 105, 2079 [Google Scholar]
- Roming, P. W. A., Kennedy, T. E., Mason, K. O., et al. 2005, Space Sci. Rev., 120, 95 [Google Scholar]
- Rybicki, G. B., & Lightman, A. P. 1979, Radiative Processes in Astrophysics (New York, USA: J. Wiley& Sons) [Google Scholar]
- Schlafly, E. F., & Finkbeiner, D. P. 2011, ApJ, 737, 103 [Google Scholar]
- Tibolla, O., Kaufmann, S., Foschini, L., et al. 2013, Int. Cosmic Ray Conf., 33, 2748 [Google Scholar]
- Turner, C. S., Miller, H. R., Maune, J. D., & Eggen, J. R. 2022, MNRAS, 517, 3257 [NASA ADS] [CrossRef] [Google Scholar]
- Waddell, S. G. H., & Gallo, L. C. 2020, MNRAS, 498, 5207 [NASA ADS] [CrossRef] [Google Scholar]
- Wajima, K., Fujisawa, K., Hayashida, M., et al. 2014, ApJ, 781, 75 [Google Scholar]
- Walton, D. J., Nardini, E., Fabian, A. C., Gallo, L. C., & Reis, R. C. 2013, MNRAS, 428, 2901 [NASA ADS] [CrossRef] [Google Scholar]
- Wang, F., Du, P., Hu, C., et al. 2016, ApJ, 824, 149 [CrossRef] [Google Scholar]
- Wang, F., Xiong, D.-R., Bai, J.-M., Li, S.-K., & Wang, J.-G. 2017, Res. Astron. Astrophys., 17, 068 [Google Scholar]
- Wood, K. S., Meekins, J. F., Yentis, D. J., et al. 1984, ApJS, 56, 507 [Google Scholar]
- Yao, S., & Komossa, S. 2023, MNRAS, 523, 441 [Google Scholar]
- Yao, S., Yuan, W., Komossa, S., et al. 2015, AJ, 150, 23 [Google Scholar]
- Zhou, H., Wang, T., Yuan, W., et al. 2007, ApJ, 658, L13 [NASA ADS] [CrossRef] [Google Scholar]
All Tables
All Figures
|
Fig. 1. Intrinsic X-ray flux in the 0.3–10 keV energy band as a function of the photon index. For observations modeled with a broken power law, the hard photon index and total flux are plotted. The vertical red line is set at a photon index of Γ ∼ 1.9, and the horizontal red line at a flux of F0.3 − 10 keV ∼ 10−11 erg cm−2 s−1. The plot is divided into three “zones”: zone 1 (top left) represents observations best modeled by a broken power law or a power law with a hard photon index; zone 2 (top right) includes observations modeled by power laws with softer photon indices and higher flux values; and zone 3 (bottom right) corresponds to observations modeled by power laws with soft photon indices and lower fluxes. The color gradient on the right represents the modified Julian date (MJD) of the observations, illustrating the temporal evolution of the source’s behavior. |
| In the text | |
|
Fig. 2. SED of Swift observations of 1H0323+342. Left: UVOT data. Right: XRT data. The plot shows unabsorbed flux (erg cm−2 s−1) on a logarithmic scale as a function of frequency (Hz), with the three distinct zones indicated: zone 1 as red squares, zone 2 as green stars, and zone 3 as blue triangles. |
| In the text | |
|
Fig. 3. Top panel: Fermi/LAT light curve in the 0.1 − 100 GeV energy range, with a clear absence of detections beginning around 2017 September 4 (MJD 58000). Bottom panel: Swift/XRT light curve in the 0.3 − 10 keV energy band, with the dashed red line set at flux, F0.3 − 10 keV ∼ 10−11 erg cm−2 s−1. We see a decrease in flux values starting from 2017 (MJD 57500-58000). |
| In the text | |
|
Fig. 4. Top panel: Evolution of the Fermi/LAT photon index from 2007 to 2024 (∼MJDs 54000-60600). Bottom panel: Changes in the photon index in the same time period with the dashed red line set at photon index Γ = 1.9. |
| In the text | |
|
Fig. 5. Photon index vs. 0.3 − 10 keV flux before and during the first 2013 γ-ray outburst. Observations span from 2011 May 19 (MJD 55700) to 2013 July 27 (MJD 56500), with numbers indicating the chronological sequence. The movement of data points between zone 1 and zone 2 highlights the evolution of the X-ray spectral state during jet activity. |
| In the text | |
|
Fig. 6. Figure 1 redrawn as an intensity-hardness plot for comparison with XRBs. The dashed red line represents the envelope of XRB regions from Dunn et al. (2010, their Fig. 4) and Motta et al. (2021, their Fig. 1). |
| In the text | |
Current usage metrics show cumulative count of Article Views (full-text article views including HTML views, PDF and ePub downloads, according to the available data) and Abstracts Views on Vision4Press platform.
Data correspond to usage on the plateform after 2015. The current usage metrics is available 48-96 hours after online publication and is updated daily on week days.
Initial download of the metrics may take a while.