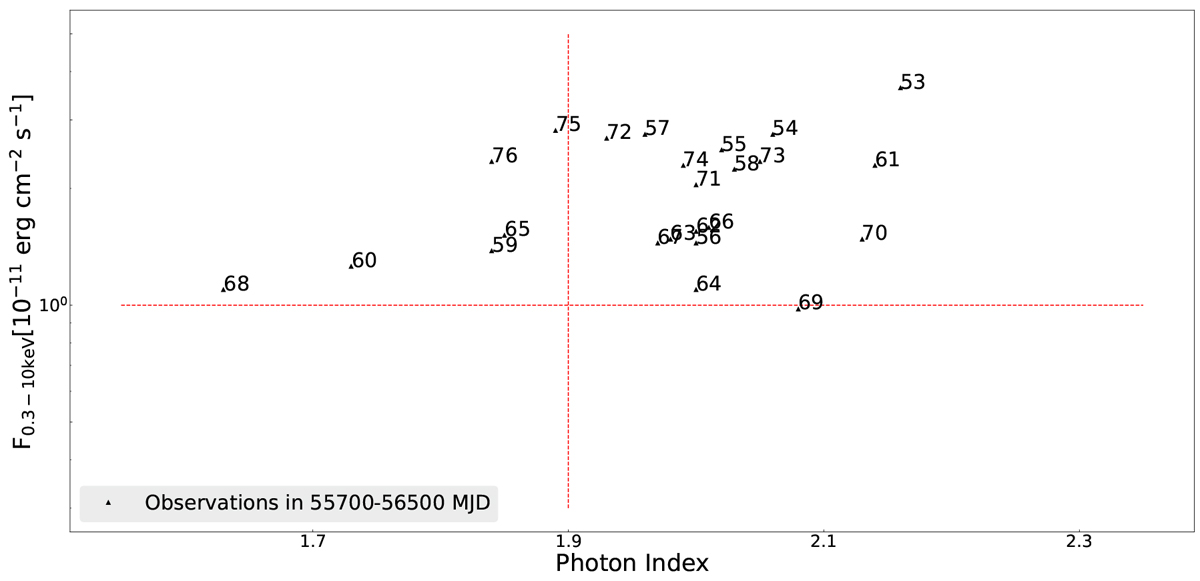
Fig. 5.
Download original image
Photon index vs. 0.3 − 10 keV flux before and during the first 2013 γ-ray outburst. Observations span from 2011 May 19 (MJD 55700) to 2013 July 27 (MJD 56500), with numbers indicating the chronological sequence. The movement of data points between zone 1 and zone 2 highlights the evolution of the X-ray spectral state during jet activity.
Current usage metrics show cumulative count of Article Views (full-text article views including HTML views, PDF and ePub downloads, according to the available data) and Abstracts Views on Vision4Press platform.
Data correspond to usage on the plateform after 2015. The current usage metrics is available 48-96 hours after online publication and is updated daily on week days.
Initial download of the metrics may take a while.