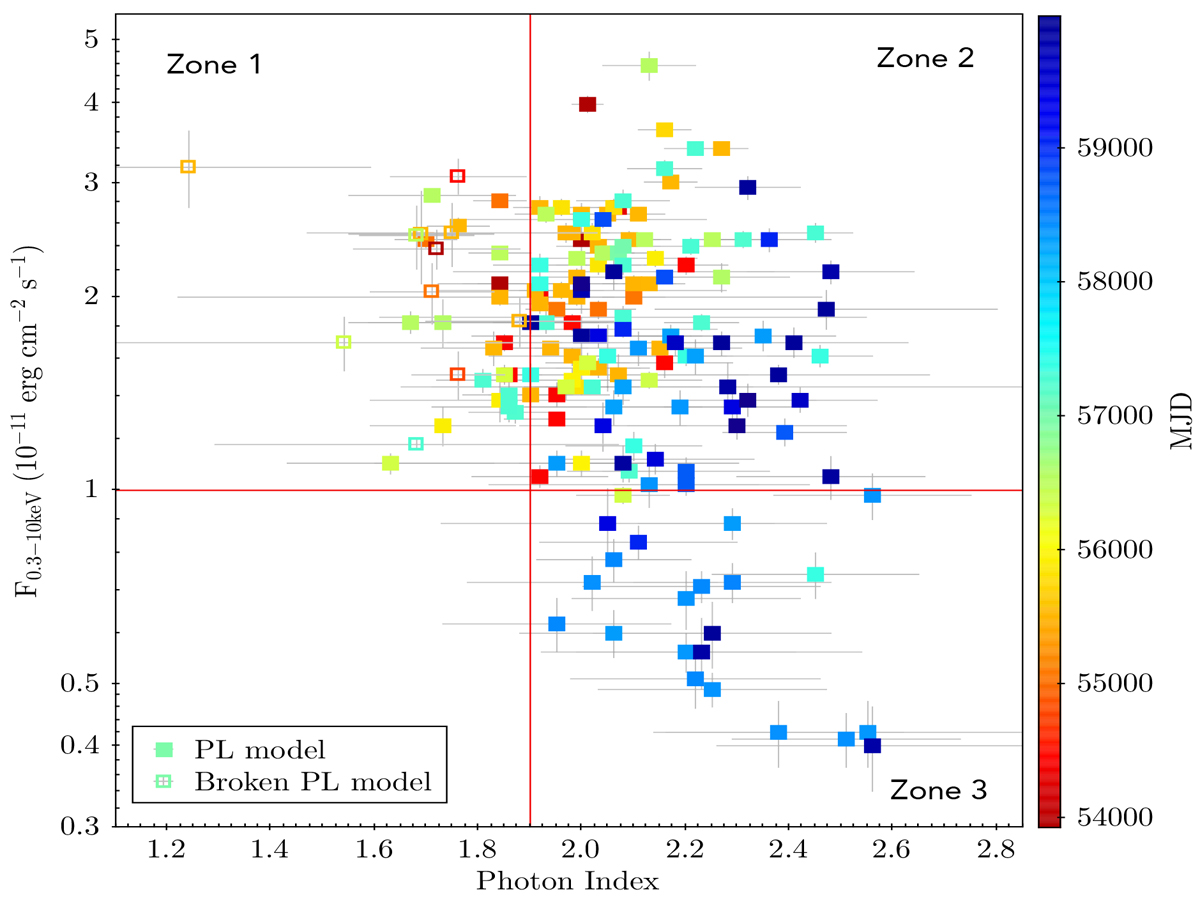
Fig. 1.
Download original image
Intrinsic X-ray flux in the 0.3–10 keV energy band as a function of the photon index. For observations modeled with a broken power law, the hard photon index and total flux are plotted. The vertical red line is set at a photon index of Γ ∼ 1.9, and the horizontal red line at a flux of F0.3 − 10 keV ∼ 10−11 erg cm−2 s−1. The plot is divided into three “zones”: zone 1 (top left) represents observations best modeled by a broken power law or a power law with a hard photon index; zone 2 (top right) includes observations modeled by power laws with softer photon indices and higher flux values; and zone 3 (bottom right) corresponds to observations modeled by power laws with soft photon indices and lower fluxes. The color gradient on the right represents the modified Julian date (MJD) of the observations, illustrating the temporal evolution of the source’s behavior.
Current usage metrics show cumulative count of Article Views (full-text article views including HTML views, PDF and ePub downloads, according to the available data) and Abstracts Views on Vision4Press platform.
Data correspond to usage on the plateform after 2015. The current usage metrics is available 48-96 hours after online publication and is updated daily on week days.
Initial download of the metrics may take a while.