Open Access
Fig. 2.
Download original image
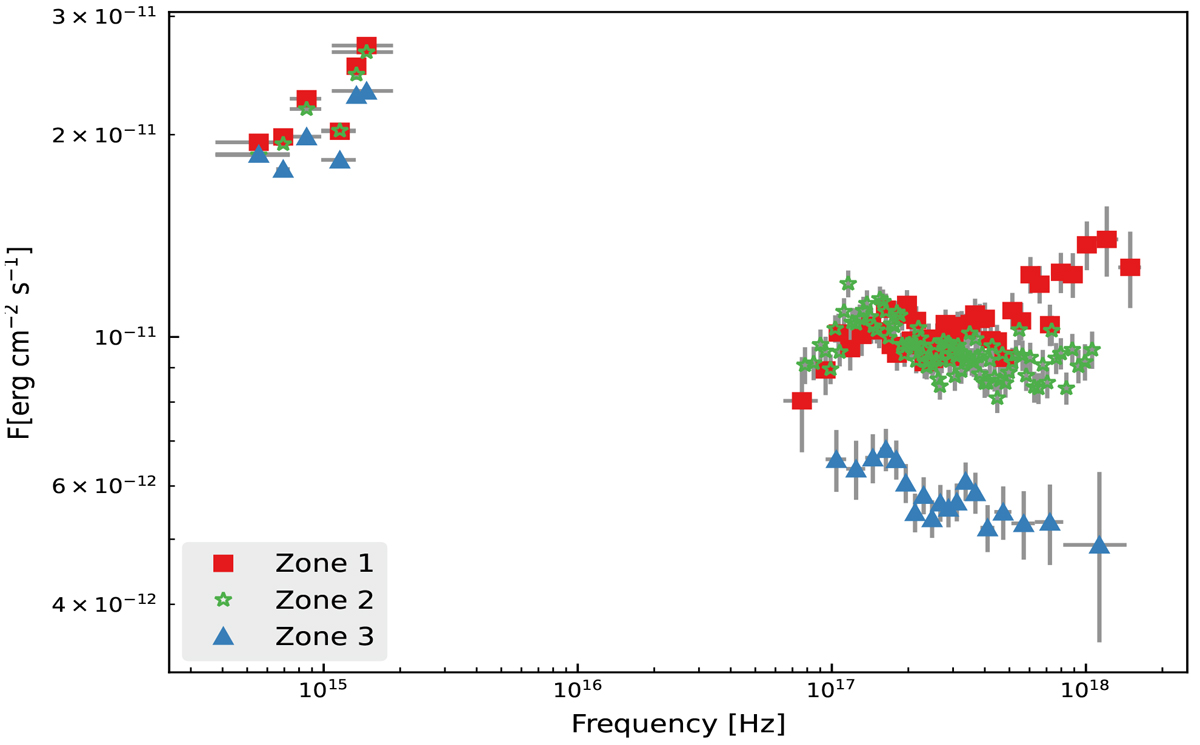
SED of Swift observations of 1H0323+342. Left: UVOT data. Right: XRT data. The plot shows unabsorbed flux (erg cm−2 s−1) on a logarithmic scale as a function of frequency (Hz), with the three distinct zones indicated: zone 1 as red squares, zone 2 as green stars, and zone 3 as blue triangles.
Current usage metrics show cumulative count of Article Views (full-text article views including HTML views, PDF and ePub downloads, according to the available data) and Abstracts Views on Vision4Press platform.
Data correspond to usage on the plateform after 2015. The current usage metrics is available 48-96 hours after online publication and is updated daily on week days.
Initial download of the metrics may take a while.