Fig. 8
Download original image
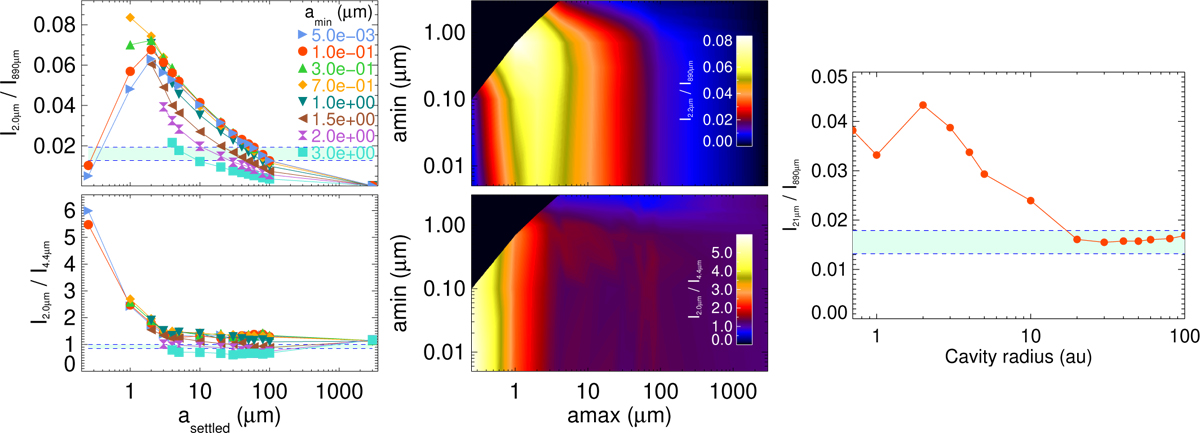
Selected NIR-to-FIR characteristic intensity ratios. Left: intensity ratios calculated as a function of asetting for the benchmark model. amin, defining the evolution of the small and large dust grain distributions, is varied from the MRN value (0.005 μm) to 3 μm. The shaded regions delimited by dotted lines represent the expected observed intensity ratios, taking into account the variations between JWST observations and previous photometric data points. The central panels are 2D representations of the same model results. Right: exploration of the effect of cavity radius on the 21 to 890 μm intensity ratio in the benchmark model, which includes the presence of an inner, partially filled, cavity. A better agreement is obtained for rcav above several tens of astronomical units.
Current usage metrics show cumulative count of Article Views (full-text article views including HTML views, PDF and ePub downloads, according to the available data) and Abstracts Views on Vision4Press platform.
Data correspond to usage on the plateform after 2015. The current usage metrics is available 48-96 hours after online publication and is updated daily on week days.
Initial download of the metrics may take a while.