| Issue |
A&A
Volume 697, May 2025
|
|
|---|---|---|
| Article Number | A53 | |
| Number of page(s) | 10 | |
| Section | Interstellar and circumstellar matter | |
| DOI | https://doi.org/10.1051/0004-6361/202453385 | |
| Published online | 07 May 2025 | |
Simple molecules and complex chemistry in a protoplanetary disk
A JWST investigation of the highly inclined disk d216-0939
1
Analytical Mineralogy Group, Institute of Geosciences, Friedrich Schiller University Jena,
Jena,
Germany
2
Max Planck Institute for Astronomy,
Heidelberg,
Germany
3
Laboratory for Astrophysics, Leiden Observatory, Leiden University,
Leiden,
The Netherlands
4
Institute of Theoretical Physics and Astrophysics, Kiel University,
Leibnizstr. 15,
24118,
Kiel,
Germany
5
National Astronomical Observatory of Japan,
Tokyo,
Japan
★ Corresponding author: This email address is being protected from spambots. You need JavaScript enabled to view it.
Received:
10
December
2024
Accepted:
20
February
2025
Abstract
Context. While the number of detected molecules, particularly complex organic molecules, in the solid state in astrophysical environments is still rather limited, laboratory experiments and astrochemical models predict many potential candidates. Detection of molecules in protoplanetary disks provides a bridge between the chemical evolution of the interstellar medium and the chemistry of planets and their atmospheres.
Aims. The excellent spectral sensitivity, broad wavelength coverage, and high spatial resolution of the James Webb Space Telescope (JWST) allows us to make progress in exploring chemical compositions of various astrophysical environments, including planet-forming disks. They are a prerequisite for probing the disk content by means of sensitive absorption studies.
Methods. In this paper we present the initial results of the JWST Cycle 1 GO programme 1741 on d216-0939, a highly inclined TTauri disk located in the outskirts of the Orion Nebula Cluster. We utilised the NIRSpec and MIRI integral field unit spectrographs to cover its spectrum from 1.7 to 28 μm.
Results. The spectra of the d216-0939 disk show clear absorption signatures of amorphous silicates and ices. We unambiguously detected the solid-state features of H2O, CO2, 13CO2, CO, OCN−, and tentatively OCS ices, species that had also been detected recently in other circumstellar disks. For the first time in disks, we provide unique detections of ices carrying NH4+ and the complex organic molecule ammonium carbamate (NH4+NH2COO−).
Conclusions. The latter detections speak for a very efficient NH3 chemistry in the disk. We also show the very important role of scattering in the analysis of observational spectra of highly inclined disks.
Key words: solid state: refractory / solid state: volatile / telescopes / circumstellar matter
© The Authors 2025
 Open Access article, published by EDP Sciences, under the terms of the Creative Commons Attribution License (https://creativecommons.org/licenses/by/4.0), which permits unrestricted use, distribution, and reproduction in any medium, provided the original work is properly cited.
This article is published in open access under the Subscribe to Open model.
Open Access funding provided by Max Planck Society.
1 Introduction
In cold dense astrophysical environments, such as molecular clouds, protostellar envelopes, and planet-forming disks beyond the snowline, the solid state is presented by dust grains mixed with molecular ices. The full composition of interstellar and circumstellar ices is still an open question. Water is the main constituent accounting for more than 60% of the ice in most lines of sight (e.g. Whittet 2003; van Dishoeck et al. 2021). In addition to water, several other molecules have been unambiguously detected in ices: CO, OCS, CO2, NH3, H2CO, HCOOH, CH4, and CH3OH (McGuire 2022) and recently OCN−, ![Mathematical equation: $\[\mathrm{NH}_{4}^{+}\]$](/articles/aa/full_html/2025/05/aa53385-24/aa53385-24-eq3.png) , and tentatively SO2 (McClure et al. 2023). Based on the results of experimental and modelling studies that simulate the conditions and chemistry of astrophysical environments, we know that chemical reactions in or on such ices triggered by UV photons, heat, atoms, and cosmic rays may lead to the formation of many complex organic molecules (COMs), including the direct precursors of prebiotic species and prebiotic species themselves, such as sugars, amino acids, and nucleobases. Here, we refer to several review papers (Theulé et al. 2013; Linnartz et al. 2015; Öberg 2016; Arumainayagam et al. 2019; Sandford et al. 2020; Potapov & McCoustra 2021; Fulvio et al. 2021).
, and tentatively SO2 (McClure et al. 2023). Based on the results of experimental and modelling studies that simulate the conditions and chemistry of astrophysical environments, we know that chemical reactions in or on such ices triggered by UV photons, heat, atoms, and cosmic rays may lead to the formation of many complex organic molecules (COMs), including the direct precursors of prebiotic species and prebiotic species themselves, such as sugars, amino acids, and nucleobases. Here, we refer to several review papers (Theulé et al. 2013; Linnartz et al. 2015; Öberg 2016; Arumainayagam et al. 2019; Sandford et al. 2020; Potapov & McCoustra 2021; Fulvio et al. 2021).
However, the detection of COMs in interstellar and circumstellar ices (in the solid state) is still a challenge because these molecules are less abundant, and their IR features are less distinct. In interstellar ice, methanol (CH3OH), has been unambiguously detected (Pontoppidan et al. 2003). In the pre-JWST era, tentative detections of acetaldehyde (CH3CHO, Schutte et al. 1999), ethanol (C2H5OH, Terwisscha van Scheltinga et al. 2018), and urea (H2NCONH2, Raunier et al. 2004) have been proposed. New JWST data have provided the first tentative (e.g. Yang et al. 2022) and then statistically robust (Rocha et al. 2024) detections of C2H5OH, CH3CHO, and methyl formate (HCOOCH3), as well as tentative detections of acetonitrile (CH3CN, McClure et al. 2023) and ethyl cyanide (C2H5CN, Nazari et al. 2024) in interstellar ices.
The detection of molecules in planet-forming disks provides a bridge between the chemical evolution of the interstellar medium (ISM) and chemistries of planets and their atmospheres. Recent JWST/NIRSpec observations of the edge-on Class II protoplanetary disk HH 48 NE revealed spatially resolved absorption features of the major ice components H2O, CO2, and CO, multiple weaker signatures from less abundant ices NH3, OCN−, and OCS and, for the first time in a protoplanetary disk, isotopologue 13CO2 ice (Sturm et al. 2023a). JWST/MIRI observations of the same disk have provided evidence for the presence of CH4 and CH3OH (Sturm et al. 2023b).
Despite these recent successes regarding smaller species, the general number of detected ice species in disks, particularly COMs, is still very limited. However, according to laboratory experiments and astrochemical models, there are many potential candidates. This manuscript presents the results of the initial analysis of JWST observations of the protoplanetary disk d216-0939, a highly inclined disk in the outskirts of the Orion Nebula Cluster, and provides assignments of the ice and dust bands detected.
2 Observations, data reduction, and analysis
2.1 Source selection
Ice bands have been observed in emission in planet-forming disks at far-infrared wavelengths (e.g. Min et al. 2016). However, to observe the near- and mid-infrared ice bands in emission one would typically need temperatures of several hundred Kelvin, which is far above the sublimation temperature. The best way to observe ice bands at near-infrared wavelengths is through absorption line studies of highly inclined disks (e.g. Terada & Tokunaga 2012). At high inclination angles the light of the central star is attenuated by the circumstellar disks, which allows us to probe a wide region of the disk.
For our study we selected the highly inclined disk d216-0939 (also known as V* V2377 Ori or HOPS 65) in Orion, a highmass star-forming region that likely resembles the birthplace of the Solar System (cf. Young 2020). In the Hubble Space Telescope (HST) paper by Smith et al. (2005) this disk system stood out as featuring a large silhouette disk in HST optical imaging. A high-resolution ALMA study has derived an inclination of the outer disk of around 75–78° (Sheehan et al. 2020). The selected target is among the few known suitably inclined disks that show indications of crystalline water ice (Terada & Tokunaga 2012; Terada et al. 2012) and strong reddening of the central star by the circumstellar disk material. As crystalline water ice forms at temperatures reached close to the snowline, this selection criterion means that we are likely probing a sightline in this system across the snowline. However, other scenarios may exist. Crystallisation may also have occurred earlier in the history of the system when the outer disk was warmer, or material may have been transported outwards after being crystallised near the snowline. We note furthermore that the locations of snowlines are not constant over the evolution of the disk, due to a variety of circumstances (e.g. Martin & Livio 2012; Owen 2020; Mori et al. 2021; Ros & Johansen 2024).
2.2 JWST observations
The highly inclined protoplanetary disk in Orion d216-0939 was observed with the integral field units (IFUs) of both the Near-Infrared Spectrograph (NIRSpec, Jakobsen et al. 2022; Böker et al. 2022) and the Mid-Infrared Instrument (MIRI, Wright et al. 2023) within our General Observation (GO) programme 1741 (PI: A. Potapov) at the end of JWST Cycle 1. The NIRSpec observations used the medium-resolution settings G235M/F170LP and G395M/F290LP to cover the 2–5 μm wavelength range, and especially to seamlessly cover the full extent of the water ice feature between 2.7 and 3.5 μm. As the target is expected to be slightly extended at the shortest wavelengths of NIRSpec we used a four-point dither. Given the IFU size we applied a target acquisition (TA) for the NIRSpec observations on two nearby stars to make sure our targets are properly centred on the image slicer. We used nearby stars with good-quality GAIA information for the TA as the target itself could show some deviation from point-source geometry at short wavelengths. As the IFU size of MIRI is large enough, no TA was needed. Observations with the MIRI Medium-Resolution Spectrograph (MRS) were done for all three grating settings so that the entire wavelength range between 5 and 28 μm was continuously covered. In the MIRI range we were especially interested in the silicate absorption features at 10 and 18 μm, as well as several faint absorption signals of complex organic molecule ices, mainly in the 5–10 μm range. For the MIRI observations we applied a four-point dither in order to obtain the proper spatial and wavelength sampling. At longer wavelengths the source is expected to be compact, meaning the background can be estimated from the observations itself, and no additional off-pointing is required.
We opted for medium-resolution spectroscopy for both instruments since the offered spectral resolution in the low-resolution mode (R~100) is too coarse to allow a robust spectral decomposition of the H2O ice features at the shortest wavelengths, and, in the case of MIRI do not cover all the required wavelengths (>10 μm). This also facilitated the proper detection and separation of gas-phase lines (e.g. from water) from the ice features. We employed the IFUs of both instruments which provides better control over the spatial distribution of the (continuum) emission and absorption signals of both the circumstellar disk and the general infrared background.
2.3 Data reduction
All data reduction was performed with the JWST pipeline (see Bushouse et al. 2024) version 1.13.4, and was based on the pmap1210 calibration scheme. We processed the raw data with slightly modified pipeline scripts. Spectral de-fringing was applied to all datasets. We relied on the extract1D step to extract the 1 D spectrum from the 2 D spectral cubes. This extracts aperture photometry per cube slice. An aperture correction is applied afterwards. Both the aperture and the aperture correction are wavelength-dependent. For MIRI we experimented with aperture scaling between 1.5 and 2.0 time the full width half max (FWHM) of the MRS instrument, and found that the smaller aperture does not change the continuum shape, but gives a slightly higher signal-to-noise ratio. For NIRSpec, the aperture size scaling within extract1D is fixed (to 2 × FWHM). For most of the data, we could use the autocentre function to enable a precise centroiding of the aperture on source before spectral extraction. We found that at the shortest wavelengths covered (λ ≲ 2.5 μm) the source deviates strongly from a point-source geometry, probably showing scattering at the more extended disk surface. We checked that the deviation from the point-source nature is negligible for the longer wavelengths where the important spectral features reside. Hence, an extraction approach relying on point source aperture corrections still seems warranted.
2.4 Approach for fitting the measurements
We do not have a well-constrained photospheric model for the central star yet. Moreover, the IR continuum may be dominated by thermal emission from warm dust in the inner disk rather than from the stellar photosphere. At this point in the project we refrained from trying to develop such a detailed radiative transfer model for the star–disk system that could guide the determination of the continuum baseline. As a pragmatic approach, we therefore used a third-order polynomial fit for the NIRSpec range with continuum points of 2.5–2.55, 2.6–2.65, 2.69–2.80, 4.0–4.04, 4.06–4.07, 4.6–5.0, 5.15–5.2 μm and two linear fits for the MIRI ranges 5.72–7.88 and 8–15.9 μm. The uncertainties introduced by the continuum do not influence the band assignments presented in the paper.
We used the ENIIGMA fitting tool (Rocha et al. 2021) to fit multiple features across the NIRSpec and MIRI spectral ranges by scaling laboratory spectra in optical depth scale of dust–ice and ice mixtures and pure ices to match the continuum-subtracted optical depths. This methodology is already described in different papers, such as Rocha et al. (2021, 2024, 2025). Briefly, these optical depth spectra (τ) are calculated as
![Mathematical equation: $\[\tau_v^{l a b}=2.3 ~A b s_\nu,\]$](/articles/aa/full_html/2025/05/aa53385-24/aa53385-24-eq4.png) (1)
(1)
where Absν is the laboratory data (absorbance) as a function of the wavenumber (ν) in units of cm−1.
Some of the ices also play a role in the scattering, which is needed to correctly reproduce the observed spectral features. We applied the computational code OPTOOL (Dominik et al. 2021) to investigate the scattering. While OPTOOL is in principle capable of computing absorption and scattering opacities, we used the tool strictly to derive the scattering opacities of different silicate grains covered with a variety of ices and ice mixtures. For the absorption opacities, we relied on the laboratory-measured ice data directly.
The relation between optical depth and opacity is given by
![Mathematical equation: $\[\tau_\nu=a ~\kappa_\nu,\]$](/articles/aa/full_html/2025/05/aa53385-24/aa53385-24-eq5.png) (2)
(2)
where a is a scaling factor.
In OPTOOL, we utilised the default approach implemented therein, which is the Distribution of Hollow Spheres (DHS) with fmax = 0.8, with compact grains (porosity set to zero) and ice mantles of different compositions. We adopted an upper size limit of 1 μm and a power law of 3.5 for the grain size distribution. This seems to be a realistic approach; however, we note that Dartois et al. (2024) found that the grain sizes can significantly alter the shapes of the ice features. We experimented with the grain size distributions, increasing the upper size limit to 2 and 3 μm; however, this did not lead to a fit improvement. Furthermore, it worsened the overall SED fit we attempted.
We used two metrics to evaluate the goodness of the fit, the root mean square error (RMSE) and the Akaike information criterion (AIC). While the RMSE measures the average difference between model and observations, the AIC can quantify the quality of the fit based on the number of parameters used for the fit. The AIC is given by
![Mathematical equation: $\[A I C=\chi^2+2 p+\frac{2 p(p+1)}{N-p-1},\]$](/articles/aa/full_html/2025/05/aa53385-24/aa53385-24-eq6.png) (3)
(3)
where p is the number of free parameters and N is the sample size. χ2 is given by
![Mathematical equation: $\[\chi^2=\frac{1}{d o f} \sum_{i=0}^{n-1}\left(\frac{\tau_{\nu, i}^{\mathrm{obs}}-\sum_{j=0}^{m-1} w_j \tau_{\nu, j}^{\mathrm{lab}}}{\gamma_{\nu, i}^{\mathrm{obs}}}\right)^2,\]$](/articles/aa/full_html/2025/05/aa53385-24/aa53385-24-eq7.png) (4)
(4)
where do f is the number of degrees of freedom (i.e. N − p), m is the number of laboratory spectra used in the fit, wj is the scaling factor applied to the individual spectra, and γ is the error in the observational optical depth spectrum. Once AIC is calculated, different models can be compared using the Δ AIC, which is defined as AICi − min(AIC), where AICi represents values for different models, and min(AIC) corresponds to the minimum AIC value. A ΔAIC value below 2 means substantial support of the model, while a Δ AIC value clearly above 2 indicates considerably less or no support of the model (Burnham & Anderson 2002). In this paper the lowest RMSE and AIC is considered the best model, which is not necessarily the model that contains more components.
 |
Fig. 1 NIRSpec (left) and MIRI (right) spectrum of the d216-0939 disk and assignments of the main spectral bands. The gas phase lines are not labelled. |
3 Results
In Figure 1, we present the complete NIRSpec + MIRI spectrum up to 18 μm of the d216-0939 disk.
In the following, we describe how we split the spectrum into regions and discuss our assignments of the dust and ice bands done using the ENIIGMA fitting tool, from short to long wavelengths starting at the 3-μm region containing the stretching vibration band of H2O and ending at the 8–16-μm region containing spectral signatures of silicates. We performed separate fits because determining a single global continuum for disks is rather challenging without an accurate radiative transfer model.
EMIIGMA fitting results for the 2.8–4.0 μm wavelength region.
3.1 2.8–4.0-micron region
The main spectral band in this region is the H2O stretching mode. It may also contain signatures of NH3, CH3OH, ![Mathematical equation: $\[\mathrm{NH}_{4}^{+}\]$](/articles/aa/full_html/2025/05/aa53385-24/aa53385-24-eq9.png) , and COMs. Particularly, ammonium salts including ammonium carbamate (
, and COMs. Particularly, ammonium salts including ammonium carbamate (![Mathematical equation: $\[\mathrm{NH}_{4}^{+} \mathrm{NH}_{2} \mathrm{COO}^{-}\]$](/articles/aa/full_html/2025/05/aa53385-24/aa53385-24-eq10.png) ) and ammonium formate (
) and ammonium formate (![Mathematical equation: $\[\mathrm{HCOO}^{-} \mathrm{NH}_{4}^{+}\]$](/articles/aa/full_html/2025/05/aa53385-24/aa53385-24-eq11.png) ) may explain the red part of the band, as was shown by the analysis of the Rosetta spectra of the comet 67P (Poch et al. 2020).
) may explain the red part of the band, as was shown by the analysis of the Rosetta spectra of the comet 67P (Poch et al. 2020).
Based on our previous results demonstrating dust–ice mixing in cold astrophysical environments Potapov et al. (2021a), we used spectral data obtained for physical mixtures of silicates and water ice. Crystalline water ice was previously detected in the d216-0939 disk (Terada & Tokunaga 2012; Potapov et al. 2021a) and its presence was one of the main parameters while choosing the target for our JWST observations.
It was also clear from the analysis of the CO2 stretching band at 4.27 μm that scattering plays a crucial role in the short-wavelength region (see Sect. 3.2). The scattering component of the H2O band was obtained utilising OPTOOL, with the optical constants as inputs obtained for the MgSiO3/H2O mixtures with the mass ratio of 2.7 and presented in Potapov et al. (2018). The absorption spectra of these mixtures were also used as absorption components of the fits.
The best fit model is shown in Figure 2 and was obtained using the spectra of MgSiO3/H2O 150 K scattering (S) + MgSiO3/H2O 100 K absorption (A) + chemistry. ‘Chemistry’ is the laboratory spectrum obtained after UV irradiation of a mixture of CO2 + NH3 at 75 K and its subsequent heating to 230 K (Potapov et al. 2022). The spectrum mainly contains spectral signatures of ammonium carbamate and carbamic acid (NH2COOH). The high-temperature (230 K) spectrum was chosen to reduce the contribution of NH3, which has strong bands at 3 and 9 μm, but is not unambiguously detected.
The AIC and RMSE were used to estimate the quality of the fits and are presented in Table 1. The criteria for the best fit were (i) the decrease in the RMSE and (ii) the increase in the AIC by not more than 2 with respect to the lowest value. We started with the 150 K absorption (A) and scattering (S) spectra as ENIIGMA inputs. We do not see clear spectral signatures of NH3 and CH3OH in the 10 μm range, where the species have the strongest bands. ![Mathematical equation: $\[\mathrm{NH}_{4}^{+}\]$](/articles/aa/full_html/2025/05/aa53385-24/aa53385-24-eq12.png) is detected at 6.85 μm (see below), and the addition of the
is detected at 6.85 μm (see below), and the addition of the ![Mathematical equation: $\[\mathrm{NH}_{4}^{+}\]$](/articles/aa/full_html/2025/05/aa53385-24/aa53385-24-eq13.png) /OCN− 80 K spectrum (originally presented in Novozamsky et al. 2001) from the LIDA database (Rocha et al. 2022) improved the fit considerably. However, the addition of the chemistry spectrum to the fit provided a much better fit and was necessary to fit the red shoulder of the band. The peaks at 3.1 and 3.3 μm coincide with the peaks of several ammonium salts (ammonium formate, ammonium citrate, ammonium sulphate, ammonium carbamate; see Poch et al. 2020). In our case, ammonium carbamate was detected in the chemistry sample (Potapov et al. 2022). The 3.3 μm peak is clearly affected by Policyclic Aromatic Hydrocarbon (PAH) emission. The addition of the
/OCN− 80 K spectrum (originally presented in Novozamsky et al. 2001) from the LIDA database (Rocha et al. 2022) improved the fit considerably. However, the addition of the chemistry spectrum to the fit provided a much better fit and was necessary to fit the red shoulder of the band. The peaks at 3.1 and 3.3 μm coincide with the peaks of several ammonium salts (ammonium formate, ammonium citrate, ammonium sulphate, ammonium carbamate; see Poch et al. 2020). In our case, ammonium carbamate was detected in the chemistry sample (Potapov et al. 2022). The 3.3 μm peak is clearly affected by Policyclic Aromatic Hydrocarbon (PAH) emission. The addition of the ![Mathematical equation: $\[\mathrm{NH}_{4}^{+}\]$](/articles/aa/full_html/2025/05/aa53385-24/aa53385-24-eq14.png) /OCN− spectrum to the fit after chemistry led to an increase in the AIC by more than 2 as a consequence of the ignorance of the
/OCN− spectrum to the fit after chemistry led to an increase in the AIC by more than 2 as a consequence of the ignorance of the ![Mathematical equation: $\[\mathrm{NH}_{4}^{+}\]$](/articles/aa/full_html/2025/05/aa53385-24/aa53385-24-eq15.png) /OCN− spectrum by the fit.
/OCN− spectrum by the fit.
At the next step we added MgSiO3/H2O 10 and 100 K (A) and (S) inputs to consider the temperature gradient in the disk. The increase in the AIC in both cases indicated that not all spectra were considered by the fit. In both cases the not considered spectra were low-temperature scattering and high-temperature absorption. Finally, the best fit was obtained for the MgSiO3/H2O 150 K (S) + MgSiO3/H2O 100 K (A) + chemistry inputs. We note that the use of MgSiO3/H2O 150 K (A) or MgSiO3/H2O 10 K (A) instead of MgSiO3/H2O 100 K (A) also provides a reasonable fit. Thus, 150 K scattering provides a defining contribution to the spectrum.
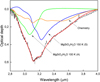 |
Fig. 2 Observational spectrum (black), the best fit model for the 2.8–4.0 μm region (red) and its components: MgSiO3/H2O 150 K (S) (blue), MgSiO3/H2O 100 K (A) (green), and chemistry (orange). |
Input datasets for fitting the CO2 region around 4.27 μm.
3.2 4.0–4.5-micron region
This spectral region contains the strong absorption feature of 12CO2 ice at 4.27 μm and the weaker ice feature of the 13CO2 variety at 4.39 μm. We note that we also detected the combination mode of 12CO2 at 2.68 μm. Very interesting is the positive bump bluewards of the 12CO2 absorption feature at 4.27 μm. This bump is relatively broad, though it does not coincide in wavelength with known solid-state features of ice, dust, or PAHs. We assume that here we see the imprint of scattering on ice mantles covering dust grains. This effect has been described and modelled by Dartois et al. (2022).
The best fit model is shown in Figure 3 and was obtained using the spectra of scattering on 13 K H2O/CO2 mantles, cold scattering on 13 K pure CO2 mantles, and absorption in 35 K H2O/CO2 mantles.
When modelling the main CO2 feature, we started with pure absorption data. A detailed overview of the utilised absorbance and optical constants is given in Table 2. We first considered moderate-temperature ice mixtures where CO2 is mixed with H2O. Absorbance data exist for temperatures of 13 K (cold), 35 K (lukewarm), and 72 K (warm). It quickly turned out that such pure absorbance reference data could not replicate the full shape of the measured CO2 feature well. They are still too narrow, they cannot capture the wide red wing, and obviously do not contain a positive (negative absorption) feature that could emulate the bump close to 4.2 μm. We therefore decided to include extinction caused by scattering also for the CO2 fitting into the selection of input data for ENIIGMA. We used OPTOOL to compute the scattering properties with the model parameters, as described in Section 2.4. To be consistent, we used optical constants for the grain core and mantle at identical or at least similar temperatures, respectively. For the grain core, we used the same MgSiO3/H2O data as above. For the mantle material, we used the optical constants from several databases (cf. Table 2). We excluded the wavelength range containing the Brackett α line at around 4.05 μm and started at 4.065 μm.
We continued with two-component fits of absorbance + scattering at similar temperatures. The red absorption wing was much better fitted by the inclusion of scattering. Additionally, the scattering produced some positive feature bluewards of the main absorption feature, although the exact shape does not agree. The fit continuously improved when going from warm absorption + warm scattering to cold absorption + cold scattering. Another clear improvement occured when including scattering of a pure cold CO2 mantle. These data offer an additional positive component that helps to fit better the truly blue part of the positive bump. Furthermore, the faint 13CO2 absorption feature1 at 4.39 μm was better captured when the pure CO2 data were included. The CO2 samples used for the laboratory reference data contained the 13C and 12C isotopologues in a ratio of 1:100. It should be noted that the pure CO2 component was also required to fit the 10-μm range (see Sect. 3.5).
When more than three components were combined, several acceptable solutions with roughly similar fit quality and RMSE are possible; however, AIC increased by more than two in all the cases. In many cases, the warm and lukewarm scattering components were ignored by ENIIGMA. However, inclusion of one variety of cold scattering was mandatory to reach a good fit. Our modelling is not fully conclusive regarding the necessity of having (luke)warm absorption and (luke)warm scattering. If given a multitude of input choices, ENIIGMA will include a 72 K absorption component in the final fit, possibly since those warm spectra have less wiggle at around 4.3 μm (probably an 18OCO feature) than cold absorption models from the spectral libraries used. The AIC and RMSE values are presented in Table 3.
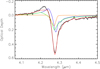 |
Fig. 3 Observations (black), the best fit model for the 4.0–4.5 μm region (red), and its components: blue – cold scattering on 13 K H2O : CO2 mantles, green – cold scattering on 13 K pure CO2 mantles, orange – absorption in 35 K H2O: CO2 mantles. |
EMIIGMA fitting results for the 4.0–4.5 μm wavelength region.
EMIIGMA fitting results for the 4.5–4.8 μm wavelength region.
3.3 4.5–4.8-micron region
This spectral region contains the spectral signatures of OCN− at 4.62 μm and CO at 4.67 μm. We fitted these two features together in ENIIGMA, but removed the strong Pfund β line at 4.65 μm from the optical depth input data before fitting since it turned out to be confusing for the fitting routine. The OCN− feature is in the ![Mathematical equation: $\[\mathrm{NH}_{4}^{+}\]$](/articles/aa/full_html/2025/05/aa53385-24/aa53385-24-eq18.png) /OCN− spectrum from LIDA database. The best fit model is presented in Figure 4. The AIC and RMSE values are presented in Table 4.
/OCN− spectrum from LIDA database. The best fit model is presented in Figure 4. The AIC and RMSE values are presented in Table 4.
There are data for ![Mathematical equation: $\[\mathrm{NH}_{4}^{+}\]$](/articles/aa/full_html/2025/05/aa53385-24/aa53385-24-eq19.png) /OCN− at 12 K and 80 K. We tested both datasets. The cold 12 K data, however, come with a quite pronounced secondary absorption feature at around 4.65 μm that is not observed in our data. The 80 K file does not show this, and is smoother and better fitting to the JWST measurements. In addition, a preference for the 80 K spectrum is a clear result of the 5.6–8 μm region fitting (see Sect. 3.4).
/OCN− at 12 K and 80 K. We tested both datasets. The cold 12 K data, however, come with a quite pronounced secondary absorption feature at around 4.65 μm that is not observed in our data. The 80 K file does not show this, and is smoother and better fitting to the JWST measurements. In addition, a preference for the 80 K spectrum is a clear result of the 5.6–8 μm region fitting (see Sect. 3.4).
Pure CO absorption data from LIDA give a rather sharp narrow absorption feature at around 4.67 μm, while our measured CO absorption profile is wider. We therefore also used CO in a H2O mixture. As an example, we used the absorbance of a H2O/CO2/CO/NH3/CH3OH mixture at 15 K from Potapov et al. (2019b) and a C/H2O mixture (containing CO) at 15 K from Potapov et al. (2021b). As a further choice, we utilised the model D8a lab data from Rocha et al. (2017), which represents a H2O/NH3/CO mixture at 13 K. With such a dataset in the mix, the core of the absorption is filled out better. The general shape, especially the absorption wing at longer wavelengths, however, is not fully replicated. Hence, we included scattering on ice mantles also for the CO range. We used model D8a, which has optical constants available to compute the scattering properties, taking the MgSiO3/H2O material properties at 10 K for the grain core. The inclusion of scattering widens the profile and fills the red wing satisfactorily. We note that the pure CO absorption is quite strongly down-weighted in the four-component mix that gives a good fitting result. The inclusion of pure CO seems to improve the RMSE to a small degree. Still, we cannot exclude the possibility that the narrow pure CO absorption just contributes to better fitting some absorption in the deepest absorption trough of the global feature that may arise from superimposed rotovibrational absorption lines of CO seen in the spectrum. We also tentatively detected OCS at 4.9 μm.
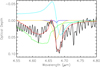 |
Fig. 4 Observations (black), the best fit model for the 4.5–4.8 μm region (red), and its components: dark blue – pure CO absorption (15 K), light blue – scattering on H2O/CO ice mantle (13 K), green – |
![Mathematical equation: $\[\mathrm{NH}_{4}^{+}\]$](/articles/aa/full_html/2025/05/aa53385-24/aa53385-24-eq20.png)
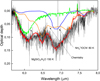 |
Fig. 5 Observations (black), the best fit model for the 5.6–8 μm region (red), and its components: MgSiO3/H2O 150 K (green) + |
![Mathematical equation: $\[\mathrm{NH}_{4}^{+}\]$](/articles/aa/full_html/2025/05/aa53385-24/aa53385-24-eq21.png)
3.4 5.6–8-micron region
This spectral region contains the H2O bending vibration mode at 6.2 μm, the ![Mathematical equation: $\[\mathrm{NH}_{4}^{+}\]$](/articles/aa/full_html/2025/05/aa53385-24/aa53385-24-eq22.png) band at 6.9 μm, and the OCN− band at 7.6 μm. The best fit model is presented in Figure 5 and was obtained using the input mixture of the spectra of MgSiO3/H2O (A) 150 K +
band at 6.9 μm, and the OCN− band at 7.6 μm. The best fit model is presented in Figure 5 and was obtained using the input mixture of the spectra of MgSiO3/H2O (A) 150 K + ![Mathematical equation: $\[\mathrm{NH}_{4}^{+}\]$](/articles/aa/full_html/2025/05/aa53385-24/aa53385-24-eq23.png) /OCN− 80 K + chemistry.
/OCN− 80 K + chemistry.
We started with the MgSiO3/H2O 100 and 150 K and ![Mathematical equation: $\[\mathrm{NH}_{4}^{+}\]$](/articles/aa/full_html/2025/05/aa53385-24/aa53385-24-eq25.png) /OCN− 12 and 80 K inputs. There is a red shift of the
/OCN− 12 and 80 K inputs. There is a red shift of the ![Mathematical equation: $\[\mathrm{NH}_{4}^{+}\]$](/articles/aa/full_html/2025/05/aa53385-24/aa53385-24-eq26.png) band with temperature. Our fits clearly show that the 12 K band does not match the observational band, and that the 80 K spectrum must be used. This was the reason for trying the
band with temperature. Our fits clearly show that the 12 K band does not match the observational band, and that the 80 K spectrum must be used. This was the reason for trying the ![Mathematical equation: $\[\mathrm{NH}_{4}^{+}\]$](/articles/aa/full_html/2025/05/aa53385-24/aa53385-24-eq27.png) /OCN− 80 K spectrum also in the 3-μm range. The use of the MgSiO3/H2O 150 K spectrum provided a better fit and was used for further fits. This intermediate result is presented in Fig. 6 where the observational spectrum is fitted by two laboratory spectra, MgSiO3/H2O 150 K and
/OCN− 80 K spectrum also in the 3-μm range. The use of the MgSiO3/H2O 150 K spectrum provided a better fit and was used for further fits. This intermediate result is presented in Fig. 6 where the observational spectrum is fitted by two laboratory spectra, MgSiO3/H2O 150 K and ![Mathematical equation: $\[\mathrm{NH}_{4}^{+}\]$](/articles/aa/full_html/2025/05/aa53385-24/aa53385-24-eq28.png) /OCN− 80 K. The
/OCN− 80 K. The ![Mathematical equation: $\[\mathrm{NH}_{4}^{+}\]$](/articles/aa/full_html/2025/05/aa53385-24/aa53385-24-eq29.png) and OCN− bands (6.85 and 7.6 μm correspondingly) are fitted well, but it is obvious that there is missing signal between 6.2 and 6.7 and between 7.0 and 7.6 μm.
and OCN− bands (6.85 and 7.6 μm correspondingly) are fitted well, but it is obvious that there is missing signal between 6.2 and 6.7 and between 7.0 and 7.6 μm.
Exactly in these regions (6.2–6.7 and 7.0–7.3 μm), ammonium carbamate (![Mathematical equation: $\[\mathrm{NH}_{4}^{+} \mathrm{NH}_{2} \mathrm{COO}^{-}\]$](/articles/aa/full_html/2025/05/aa53385-24/aa53385-24-eq30.png) ), the product of CO2 + NH3 chemistry, has spectral signatures (Bossa et al. 2008; Potapov et al. 2019a). The next input to the model was the chemistry spectrum, which contains the aforementioned bands of ammonium carbamate. This led to the best fit shown in Fig. 5. An excess signal around 7.5 μm in the observational spectrum points to possible additional components. As potential candidates we considered refractory hydrocarbons obtained by UV irradiation of CH3OH ice (the spectrum was presented in Potapov et al. 2021a), as well as CH4 from the LIDA database (presented in Rachid et al. 2020). The additions of these components did not improve the fit. The AIC and RMSE values are presented in Table 5.
), the product of CO2 + NH3 chemistry, has spectral signatures (Bossa et al. 2008; Potapov et al. 2019a). The next input to the model was the chemistry spectrum, which contains the aforementioned bands of ammonium carbamate. This led to the best fit shown in Fig. 5. An excess signal around 7.5 μm in the observational spectrum points to possible additional components. As potential candidates we considered refractory hydrocarbons obtained by UV irradiation of CH3OH ice (the spectrum was presented in Potapov et al. 2021a), as well as CH4 from the LIDA database (presented in Rachid et al. 2020). The additions of these components did not improve the fit. The AIC and RMSE values are presented in Table 5.
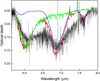 |
Fig. 6 Intermediate model for the 5.6–8 μm region including MgSiO3/H2O 150 K (green) and |
![Mathematical equation: $\[\mathrm{NH}_{4}^{+}\]$](/articles/aa/full_html/2025/05/aa53385-24/aa53385-24-eq24.png)
3.5 8–16-micron region
This spectral region contains the silicate stretching band around 10 μm, the water librational band around 12 μm, and the CO2 bending band around 15 μm. The best fit model is presented in Fig. 7 and was obtained using the input mixture of the spectra of MgSiO3/H2O 150 K, Mg2SiO4/H2O 150 K (both spectra presented in Potapov et al. 2021a), CO2, H2O/CO2, and H2O/NH3 (the spectra were presented in Rocha & Pilling 2014; Rocha et al. 2017; McClure et al. 2023).
We started with three-component models including CO2 and H2O/CO2 spectra (based on the CO2 results presented above) and 10, 100, or 150 K MgSiO3/H2O spectra. The inclusion of the second CO2 component was necessary to fit the CO2 band at 15 μm. We clearly observe the splitting of the band caused the segregation and/or distillation causing CO2 to be present in the pure form as well (cf. Isokoski et al. 2013). The MgSiO3/H2O 150 K spectrum provided the best fit from the three choices, and we used it in the following. At the next step, we added spectra of other silicates mixed with water ice, namely the Mg2SiO4/H2O 150 K and MgFeSiO4/H2O 150 K spectra. The addition of the Mg2SiO4/H2O spectrum led to an improvement in the fit. At the next step we tried to add low-temperature components, such as MgSiO3/H2O 10 and 100 K, H2O/CH3OH, H2O/NH3 and H2O/CO/CO2/NH3/CH3OH at 10 K, and high-temperature components, such as H2O/CO2/NH3 at 150 K and H2O/CO2/NH3/CH3OH at 100 K. Only the H2O/NH3 addition improved the fit. Thus, a small amount of cold ammonia may be present in the disk ices. The AIC and RMSE values are presented in Table 6.
EMIIGMA fitting results for the 5.6–8.0 μm wavelength region.
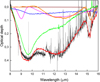 |
Fig. 7 Observations (black), the best fit model for the 8–16 μm region (red), and its components: MgSiO3/H2O 150 K (green), Mg2SiO4/H2O (blue), H2O/NH3 (magenta), H2O/CO2 (orange), CO2 (brown). |
4 Discussion
4.1 NH3 chemistry and complex organic molecules
Ammonium carbamate is a product of the NH3 + CO2 chemistry (reaction CO2 + 2NH3 → ![Mathematical equation: $\[\mathrm{NH}_{4}^{+}\]$](/articles/aa/full_html/2025/05/aa53385-24/aa53385-24-eq33.png) NH2COO−), which, as was shown by laboratory experiments, can be triggered by heat (above 60–65 K, Bossa et al. 2008; Potapov et al. 2019a, 2020) and much less efficiently by energetic processing (Bossa et al. 2008). The detection of ammonium carbamate is consistent with the detection of
NH2COO−), which, as was shown by laboratory experiments, can be triggered by heat (above 60–65 K, Bossa et al. 2008; Potapov et al. 2019a, 2020) and much less efficiently by energetic processing (Bossa et al. 2008). The detection of ammonium carbamate is consistent with the detection of ![Mathematical equation: $\[\mathrm{NH}_{4}^{+}\]$](/articles/aa/full_html/2025/05/aa53385-24/aa53385-24-eq34.png) and OCN−, as these two molecular ices are also the products of NH3 chemistry, where NH3 reacts with HNCO leading to the production of both species via a direct pure thermal acid-base reaction or with CO leading, if energetically triggered (UV photons, ions), to the production of OCN− (Novozamsky et al. 2001; Martinez et al. 2014).
and OCN−, as these two molecular ices are also the products of NH3 chemistry, where NH3 reacts with HNCO leading to the production of both species via a direct pure thermal acid-base reaction or with CO leading, if energetically triggered (UV photons, ions), to the production of OCN− (Novozamsky et al. 2001; Martinez et al. 2014). ![Mathematical equation: $\[\mathrm{NH}_{4}^{+}\]$](/articles/aa/full_html/2025/05/aa53385-24/aa53385-24-eq35.png) can be also produced by ultraviolet photolysis of NH3–H2O ice mixtures (Moon et al. 2010) and, in principle, can be a product of the dissociation of ammonium carbamate.
can be also produced by ultraviolet photolysis of NH3–H2O ice mixtures (Moon et al. 2010) and, in principle, can be a product of the dissociation of ammonium carbamate.
Pure thermal reactions definitely take place in planet-forming disks, and thus the formation of all three species (![Mathematical equation: $\[\mathrm{NH}_{4}^{+} \mathrm{NH}_{2} \mathrm{COO}^{-}, \mathrm{NH}_{4}^{+}, \mathrm{OCN}^{-}\]$](/articles/aa/full_html/2025/05/aa53385-24/aa53385-24-eq36.png) ) can be directly related to the disk chemistry. The detection of these molecules is consistent with a questionable detection of NH3 and non-detection of warm CO2, clearly showing their efficient involvement into the disk chemistry and their evolution tracks. Energetic processing may take place in both the disk and its parent molecular cloud environments; however, the midplanes and warmer layers of planet-forming disks, the locations of molecular ices, are shielded from external UV fields. An open question is the survival of the molecules, if formed in the parent molecular cloud, during the chemical evolution of the environment (transformation of a cloud into a disk). Dissociation, desorption, and further reactions of the species may lead to their disappearance. Moreover, ammonium carbamate has not been detected in molecular clouds. Thus, the synthesis of the detected species can be referred to both the disk studied and the molecular cloud from which it was formed, with a clear preference to the disk.
) can be directly related to the disk chemistry. The detection of these molecules is consistent with a questionable detection of NH3 and non-detection of warm CO2, clearly showing their efficient involvement into the disk chemistry and their evolution tracks. Energetic processing may take place in both the disk and its parent molecular cloud environments; however, the midplanes and warmer layers of planet-forming disks, the locations of molecular ices, are shielded from external UV fields. An open question is the survival of the molecules, if formed in the parent molecular cloud, during the chemical evolution of the environment (transformation of a cloud into a disk). Dissociation, desorption, and further reactions of the species may lead to their disappearance. Moreover, ammonium carbamate has not been detected in molecular clouds. Thus, the synthesis of the detected species can be referred to both the disk studied and the molecular cloud from which it was formed, with a clear preference to the disk.
One of the fundamental questions regarding small Solar System bodies (comets, asteroids, and their meteoritic remains) is the origin of detected complex organics, particularly the building blocks of biological macromolecules, such as sugars, amino acids, and nucleobases. Whether these species originate from the parent of the Solar System protoplanetary disk or from the interstellar cloud is a long-standing discussion in the astrochemical community. Many complex organic molecules have been detected in comets. Our particular attention attracted the detection of ammonium salts, such as ammonium carbamate (![Mathematical equation: $\[\mathrm{NH}_{4}^{+} \mathrm{NH}_{2} \mathrm{COO}^{-}\]$](/articles/aa/full_html/2025/05/aa53385-24/aa53385-24-eq37.png) ), ammonium formate (
), ammonium formate (![Mathematical equation: $\[\mathrm{HCOO}^{-} \mathrm{NH}_{4}^{+}\]$](/articles/aa/full_html/2025/05/aa53385-24/aa53385-24-eq38.png) ), and ammonium sulphate
), and ammonium sulphate ![Mathematical equation: $\[(\mathrm{NH}_{4}^{+})_{2} \mathrm{SO}_{4}^{2-}\]$](/articles/aa/full_html/2025/05/aa53385-24/aa53385-24-eq39.png) (Poch et al. 2020). Ammonium salts may dominate the reservoir of nitrogen in comets and asteroids and, considering previous exogenous delivery hypotheses (e.g. Oró 1961; Brack 1991), on the early Earth. Being delivered to the early Earth and mixed in liquid water, ammonium salts could have participated in prebiotic reactions leading to the synthesis of amino acids, nucleobases, and sugars (Lerner & Cooper 2005; Dziedzic et al. 2009; Callahan et al. 2011). For instance, ammonium carbamate can be a precursor of urea CO(NH2)2 and urea, in turn, is a possible precursor of pyrimidine C4H4N2, which is required for the synthesis of nucleobases in RNA molecules (Robertson & Miller 1995). Thus, the detection of ammonium carbamate in the protoplanetary disk links parent protoplanetary and daughter planetary environments, and brings us one step closer to the understanding of the processes and conditions leading to the formation of prebiotic worlds. Moreover, as the Solar System is believed to have formed in a massive star-forming region, the Orion disks most likely represent analogues of the protoplanetary disk phase of the Solar System (e.g. Young 2020; Dauphas & Chaussidon 2011, and references therein). The detection of ammonium salts in the Orion disks can then be directly linked to their detection in Solar System objects, for example the comet 67P.
(Poch et al. 2020). Ammonium salts may dominate the reservoir of nitrogen in comets and asteroids and, considering previous exogenous delivery hypotheses (e.g. Oró 1961; Brack 1991), on the early Earth. Being delivered to the early Earth and mixed in liquid water, ammonium salts could have participated in prebiotic reactions leading to the synthesis of amino acids, nucleobases, and sugars (Lerner & Cooper 2005; Dziedzic et al. 2009; Callahan et al. 2011). For instance, ammonium carbamate can be a precursor of urea CO(NH2)2 and urea, in turn, is a possible precursor of pyrimidine C4H4N2, which is required for the synthesis of nucleobases in RNA molecules (Robertson & Miller 1995). Thus, the detection of ammonium carbamate in the protoplanetary disk links parent protoplanetary and daughter planetary environments, and brings us one step closer to the understanding of the processes and conditions leading to the formation of prebiotic worlds. Moreover, as the Solar System is believed to have formed in a massive star-forming region, the Orion disks most likely represent analogues of the protoplanetary disk phase of the Solar System (e.g. Young 2020; Dauphas & Chaussidon 2011, and references therein). The detection of ammonium salts in the Orion disks can then be directly linked to their detection in Solar System objects, for example the comet 67P.
EMIIGMA fitting results for the 8–16 μm wavelength region.
4.2 Warm vs cold
Highly inclined disks, which are not completely edge-on (inclination angles of 70–85 degrees) present a particular interest. As shown for the HH 48 NE disk (see Sturm et al. 2024), the location of the ices detected in the NIRSpec range is mainly warm layers significantly above the midplane. This is consistent with our detections of warm water ice (100/150 K) at 3 μm, warm ![Mathematical equation: $\[\mathrm{NH}_{4}^{+}\]$](/articles/aa/full_html/2025/05/aa53385-24/aa53385-24-eq40.png) (80 K) at 7 μm, and ammonium carbamate (a result of warm chemistry). Detection of cold CO speaks for its presence only in the midplane of the disk due to its very low desorption temperature (around 30 K) and Sturm et al. (2024) had the same view. The detection of only cold CO2 (which has a desorption temperature of 85 K) points to its presence only near the mid-plane of the disk and its depletion in the warmer layer of the disk due to the efficient NH3 + CO2 chemistry discussed above. In the 10-μm range, the absorption is predominantly from regions near the disk midplane (cf. Sturm et al. 2024), and here we detect a mixture of cold and warm materials.
(80 K) at 7 μm, and ammonium carbamate (a result of warm chemistry). Detection of cold CO speaks for its presence only in the midplane of the disk due to its very low desorption temperature (around 30 K) and Sturm et al. (2024) had the same view. The detection of only cold CO2 (which has a desorption temperature of 85 K) points to its presence only near the mid-plane of the disk and its depletion in the warmer layer of the disk due to the efficient NH3 + CO2 chemistry discussed above. In the 10-μm range, the absorption is predominantly from regions near the disk midplane (cf. Sturm et al. 2024), and here we detect a mixture of cold and warm materials.
5 Conclusions
The highly inclined disk d216-0939 has been observed by JWST. The analysis of the absorption bands shows the presence of simple and complex molecular species. For the first time, the complex organic molecule ammonium carbamate has been detected in astrophysical environments, pointing to the complex chemistry taking place in protoplanetary disks. Together with the detection of ammonium salts in the Solar System Comet 67P, this result links protoplanetary disks and minor bodies of the Solar System.
Acknowledgements
We thank the referee for a constructive report. We are grateful to the JWST team for the wonderful observations. This work is based on observations made with the NASA/ESA/CSA James Webb Space Telescope. The data were obtained from the Mikulski Archive for Space Telescopes at the Space Telescope Science Institute, which is operated by the Association of Universities for Research in Astronomy, Inc., under NASA contract NAS 5-03127 for JWST. These observations are associated with programme #1741. The study was supported by the Federal Ministry for Economic Affairs and Climate Action on the basis of a decision by the German Bundestag (the German Aerospace Center project 50OR2215). A.P. acknowledges support from the Deutsche Forschungsgemeinschaft (Heisenberg grant PO 1542/7-1).
References
- Arumainayagam, C. R., Garrod, R. T., Boyer, M. C., et al. 2019, Chem. Soc. Rev., 48, 2293 [Google Scholar]
- Böker, T., Arribas, S., Lützgendorf, N., et al. 2022, A&A, 661, A82 [NASA ADS] [CrossRef] [EDP Sciences] [Google Scholar]
- Bossa, J. B., Theulé, P., Duvernay, F., Borget, F., & Chiavassa, T. 2008, A&A, 492, 719 [NASA ADS] [CrossRef] [EDP Sciences] [Google Scholar]
- Brack, A. 1991, Grana, 30, 505 [Google Scholar]
- Burnham, K., & Anderson, D. 2002, Model Selection and Multimodel Inference: A Practical Information-Theoretic Approach (Springer Verlag) [Google Scholar]
- Bushouse, H., Eisenhamer, J., Dencheva, N., et al. 2024, https://doi.org/10.5281/zenodo.6984365 [Google Scholar]
- Callahan, M. P., Smith, K. E., Cleaves, H. J., et al. 2011, PNAS, 108, 13995 [Google Scholar]
- Dartois, E., Noble, J. A., Ysard, N., Demyk, K., & Chabot, M. 2022, A&A, 666, A153 [NASA ADS] [CrossRef] [EDP Sciences] [Google Scholar]
- Dartois, E., Noble, J. A., Caselli, P., et al. 2024, Nat. Astron., 8, 359 [NASA ADS] [CrossRef] [Google Scholar]
- Dauphas, N., & Chaussidon, M. 2011, Annu. Rev. Earth Planet. Sci., 39, 351 [Google Scholar]
- Dominik, C., Min, M., & Tazaki, R. 2021, OPTOOL: Command-line driven tool for creating complex dust opacities, Astrophysics Source Code Library, [record ascl:2104.010] [Google Scholar]
- Dziedzic, P., Bartoszewicz, A., & Córdova, A. 2009, Tetrahedron Lett., 50, 7242 [Google Scholar]
- Fulvio, D., Potapov, A., He, J., & Henning, T. 2021, Life, 11, 568 [Google Scholar]
- Isokoski, K., Poteet, C. A., & Linnartz, H. 2013, A&A, 555, A85 [NASA ADS] [CrossRef] [EDP Sciences] [Google Scholar]
- Jakobsen, P., Ferruit, P., Alves de Oliveira, C., et al. 2022, A&A, 661, A80 [NASA ADS] [CrossRef] [EDP Sciences] [Google Scholar]
- Lerner, N. R., & Cooper, G. W. 2005, Geochim. Cosmochim. Acta, 69, 2901 [Google Scholar]
- Linnartz, H., Ioppolo, S., & Fedoseev, G. 2015, Int. Rev. Phys. Chem., 34, 205 [Google Scholar]
- Martin, R. G., & Livio, M. 2012, MNRAS, 425, L6 [Google Scholar]
- Martinez, R., Bordalo, V., da Silveira, E. F., & Boechat-Roberty, H. M. 2014, MNRAS, 444, 3317 [NASA ADS] [CrossRef] [Google Scholar]
- McClure, M. K., Rocha, W. R. M., Pontoppidan, K. M., et al. 2023, Nat. Astron., 7, 431 [NASA ADS] [CrossRef] [Google Scholar]
- McGuire, B. A. 2022, ApJS, 259, 30 [NASA ADS] [CrossRef] [Google Scholar]
- Min, M., Bouwman, J., Dominik, C., et al. 2016, A&A, 593, A11 [NASA ADS] [CrossRef] [EDP Sciences] [Google Scholar]
- Moon, E.-S., Kang, H., Oba, Y., Watanabe, N., & Kouchi, A. 2010, ApJ, 713, 906 [Google Scholar]
- Mori, S., Okuzumi, S., Kunitomo, M., & Bai, X.-N. 2021, ApJ, 916, 72 [NASA ADS] [CrossRef] [Google Scholar]
- Nazari, P., Rocha, W. R. M., Rubinstein, A. E., et al. 2024, A&A, 686, A71 [NASA ADS] [CrossRef] [EDP Sciences] [Google Scholar]
- Novozamsky, J. H., Schutte, W. A., & Keane, J. V. 2001, A&A, 379, 588 [NASA ADS] [CrossRef] [EDP Sciences] [Google Scholar]
- Öberg, K. I. 2016, Chem. Rev., 116, 9631 [Google Scholar]
- Oró, J. 1961, Nature, 190, 389 [CrossRef] [Google Scholar]
- Owen, J. E. 2020, MNRAS, 495, 3160 [Google Scholar]
- Poch, O., Istiqomah, I., Quirico, E., et al. 2020, Science, 367, aaw7462 [NASA ADS] [CrossRef] [Google Scholar]
- Pontoppidan, K. M., Dartois, E., van Dishoeck, E. F., Thi, W. F., & d’Hendecourt, L. 2003, A&A, 404, L17 [NASA ADS] [CrossRef] [EDP Sciences] [Google Scholar]
- Potapov, A., & McCoustra, M. 2021, Int. Rev. Phys. Chem., 40, 299 [CrossRef] [Google Scholar]
- Potapov, A., Jäger, C., & Henning, T. 2018, ApJ, 865, 58 [NASA ADS] [CrossRef] [Google Scholar]
- Potapov, A., Theulé, P., Jäger, C., & Henning, T. 2019a, ApJ, 878, L20 [NASA ADS] [CrossRef] [Google Scholar]
- Potapov, A., Jäger, C., & Henning, T. 2019b, ApJ, 880, 12 [NASA ADS] [CrossRef] [Google Scholar]
- Potapov, A., Jäger, C., & Henning, T. 2020, ApJ, 894, 110 [NASA ADS] [CrossRef] [Google Scholar]
- Potapov, A., Bouwman, J., Jäger, C., & Henning, T. 2021a, Nat. Astron., 5, 78 [NASA ADS] [CrossRef] [Google Scholar]
- Potapov, A., Krasnokutski, S. A., Jäger, C., & Henning, T., 2021b, ApJ, 920, 111 [CrossRef] [Google Scholar]
- Potapov, A., Fulvio, D., Krasnokutski, S., Jäger, C., & Henning, T. 2022, J. Phys. Chem. A, 126, 1627 [NASA ADS] [CrossRef] [Google Scholar]
- Rachid, M. G., Terwisscha van Scheltinga, J., Koletzki, D., & Linnartz, H. 2020, A&A, 639, A4 [EDP Sciences] [Google Scholar]
- Raunier, S., Chiavassa, T., Duvernay, F., et al. 2004, A&A, 416, 165 [NASA ADS] [CrossRef] [EDP Sciences] [Google Scholar]
- Robertson, M. P., & Miller, S. L. 1995, Nature, 375, 772 [Google Scholar]
- Rocha, W. R. M., & Pilling, S. 2014, Spectroch. Acta A Mol. Biomol. Spectrosc., 123, 436 [Google Scholar]
- Rocha, W. R. M., Pilling, S., de Barros, A. L. F., et al. 2017, MNRAS, 464, 754 [NASA ADS] [CrossRef] [Google Scholar]
- Rocha, W. R. M., Perotti, G., Kristensen, L. E., & Jørgensen, J. K. 2021, A&A, 654, A158 [NASA ADS] [CrossRef] [EDP Sciences] [Google Scholar]
- Rocha, W. R. M., Rachid, M. G., Olsthoorn, B., et al. 2022, A&A, 668, A63 [NASA ADS] [CrossRef] [EDP Sciences] [Google Scholar]
- Rocha, W. R. M., van Dishoeck, E. F., Ressler, M. E., et al. 2024, A&A, 683, A124 [NASA ADS] [CrossRef] [EDP Sciences] [Google Scholar]
- Rocha, W. R. M., McClure, M. K., Sturm, J. A., et al. 2025, A&A, 693, A288 [NASA ADS] [CrossRef] [EDP Sciences] [Google Scholar]
- Ros, K., & Johansen, A. 2024, A&A, 686, A237 [NASA ADS] [CrossRef] [EDP Sciences] [Google Scholar]
- Sandford, S. A., Nuevo, M., Bera, P. P., & Lee, T. J. 2020, Chem. Rev., 120, 4616 [NASA ADS] [CrossRef] [Google Scholar]
- Schutte, W. A., Boogert, A. C. A., Tielens, A. G. G. M., et al. 1999, A&A, 343, 966 [NASA ADS] [Google Scholar]
- Sheehan, P. D., Tobin, J. J., Federman, S., Megeath, S. T., & Looney, L. W. 2020, ApJ, 902, 141 [Google Scholar]
- Smith, N., Bally, J., Licht, D., & Walawender, J. 2005, AJ, 129, 382 [NASA ADS] [CrossRef] [Google Scholar]
- Sturm, J. A., McClure, M. K., Beck, T. L., et al. 2023a, A&A, 679, A138 [NASA ADS] [CrossRef] [EDP Sciences] [Google Scholar]
- Sturm, J. A., McClure, M. K., Bergner, J. B., et al. 2023b, A&A, 677, A18 [NASA ADS] [CrossRef] [EDP Sciences] [Google Scholar]
- Sturm, J. A., McClure, M. K., Harsono, D., et al. 2024, A&A, 689, A92 [NASA ADS] [CrossRef] [EDP Sciences] [Google Scholar]
- Terada, H., & Tokunaga, A. T. 2012, ApJ, 753, 19 [NASA ADS] [CrossRef] [Google Scholar]
- Terada, H., Tokunaga, A. T., Pyo, T.-S., et al. 2012, AJ, 144, 175 [NASA ADS] [CrossRef] [Google Scholar]
- Terwisscha van Scheltinga, J., Ligterink, N. F. W., Boogert, A. C. A., van Dishoeck, E. F., & Linnartz, H. 2018, A&A, 611, A35 [NASA ADS] [CrossRef] [EDP Sciences] [Google Scholar]
- Theulé, P., Duvernay, F., Danger, G., et al. 2013, Adv. Space Res., 52, 1567 [CrossRef] [Google Scholar]
- van Dishoeck, E. F., Kristensen, L. E., Mottram, J. C., et al. 2021, A&A, 648, A24 [NASA ADS] [CrossRef] [EDP Sciences] [Google Scholar]
- Whittet, D. C. B., ed. 2003, Dust in the Galactic Environment, 2nd edn. (Institute of Physics (IOP) Publishing) [Google Scholar]
- Wright, G. S., Rieke, G. H., Glasse, A., et al. 2023, PASP, 135, 048003 [NASA ADS] [CrossRef] [Google Scholar]
- Yang, Y.-L., Green, J. D., Pontoppidan, K. M., et al. 2022, ApJ, 941, L13 [NASA ADS] [CrossRef] [Google Scholar]
- Young, E. D. 2020, in IAU Symposium, 345, Origins: From the Protosun to the First Steps of Life, eds. B. G. Elmegreen, L. V. Tóth, & M. Güdel, 70 [Google Scholar]
The 13CO2 feature at around 4.39 μm also seems to show a positive (scattering) bump bluewards of its absorption maximum, similar to the one discussed for the 12CO2 feature.
All Tables
All Figures
|
Fig. 1 NIRSpec (left) and MIRI (right) spectrum of the d216-0939 disk and assignments of the main spectral bands. The gas phase lines are not labelled. |
| In the text | |
|
Fig. 2 Observational spectrum (black), the best fit model for the 2.8–4.0 μm region (red) and its components: MgSiO3/H2O 150 K (S) (blue), MgSiO3/H2O 100 K (A) (green), and chemistry (orange). |
| In the text | |
|
Fig. 3 Observations (black), the best fit model for the 4.0–4.5 μm region (red), and its components: blue – cold scattering on 13 K H2O : CO2 mantles, green – cold scattering on 13 K pure CO2 mantles, orange – absorption in 35 K H2O: CO2 mantles. |
| In the text | |
|
Fig. 4 Observations (black), the best fit model for the 4.5–4.8 μm region (red), and its components: dark blue – pure CO absorption (15 K), light blue – scattering on H2O/CO ice mantle (13 K), green – |
| In the text | |
|
Fig. 5 Observations (black), the best fit model for the 5.6–8 μm region (red), and its components: MgSiO3/H2O 150 K (green) + |
| In the text | |
|
Fig. 6 Intermediate model for the 5.6–8 μm region including MgSiO3/H2O 150 K (green) and |
| In the text | |
|
Fig. 7 Observations (black), the best fit model for the 8–16 μm region (red), and its components: MgSiO3/H2O 150 K (green), Mg2SiO4/H2O (blue), H2O/NH3 (magenta), H2O/CO2 (orange), CO2 (brown). |
| In the text | |
Current usage metrics show cumulative count of Article Views (full-text article views including HTML views, PDF and ePub downloads, according to the available data) and Abstracts Views on Vision4Press platform.
Data correspond to usage on the plateform after 2015. The current usage metrics is available 48-96 hours after online publication and is updated daily on week days.
Initial download of the metrics may take a while.