Fig. 6
Download original image
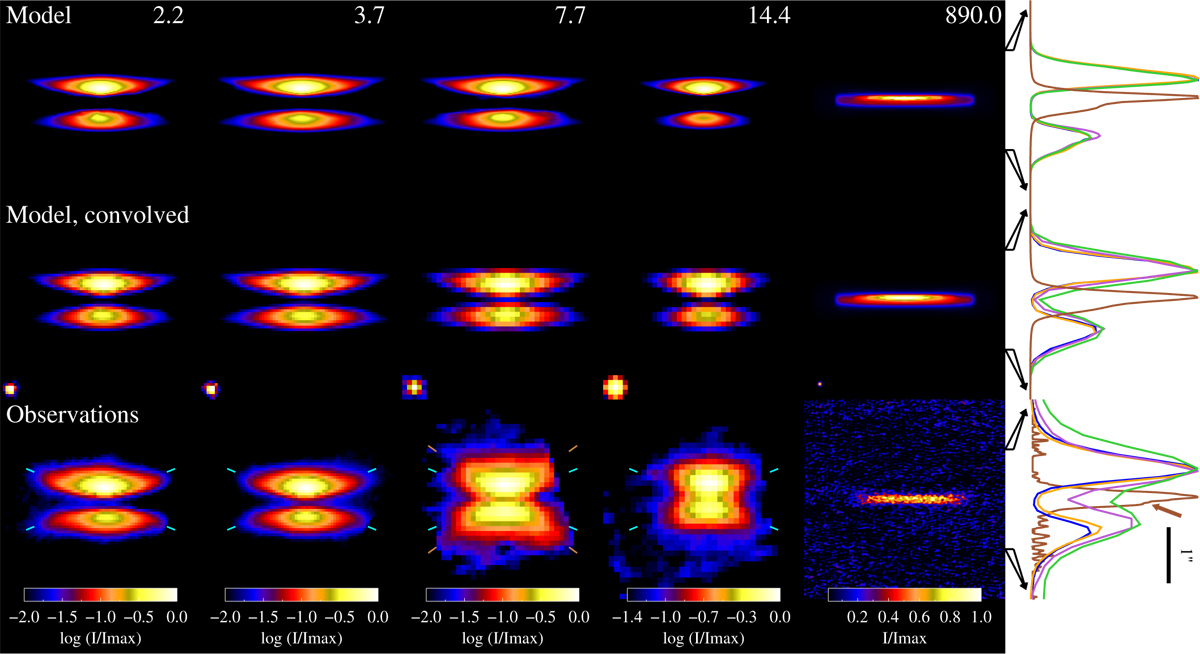
Standard model. (upper) Model images at full resolution for selected wavelengths spanning the NIR to millimetre range. (middle) Model images once convolved with the JWST or ALMA PSF. (lower) JWST NIRSpec (2.2 and 3.7 μm), MIRI (7.7 and 14.4 μm), and ALMA Band 7 (890 μm) observations. Blue ticks are guides to the small wings observed at about 22.5∘, especially in the NIR, whereas brown tickmarks indicate an angle of 36∘ overplotted on the 7.7 μm image, corresponding to the angle for the X-shape discussed by Duchêne et al. (2024), and close to the H2 wind (semi-opening) angle previously observed in the 35–38.5∘ range by Arulanantham et al. (2024); Pascucci et al. (2025). The colorbars indicate the intensity levels, normalised to the maximum intensity for each image, in log scale except for ALMA data presented in linear scale. The right panel are cuts along the vertical line through the centre of the disc observations and models at the corresponding wavelengths (2.2 μm−blue; 3.7 μm-orange; 7.7 μm – purple; 14.4 μm – green, and 890 μm – brown). The spatial scale is expanded (shown with the black arrows) by a factor of two as compared to the images for a clearer view. The adopted blue-red-yellow color table was chosen to enhance the visibility of details in the structure. A version of this same figure with a uniform red temperature color table is presented in the appendix.
Current usage metrics show cumulative count of Article Views (full-text article views including HTML views, PDF and ePub downloads, according to the available data) and Abstracts Views on Vision4Press platform.
Data correspond to usage on the plateform after 2015. The current usage metrics is available 48-96 hours after online publication and is updated daily on week days.
Initial download of the metrics may take a while.