Fig. 3
Download original image
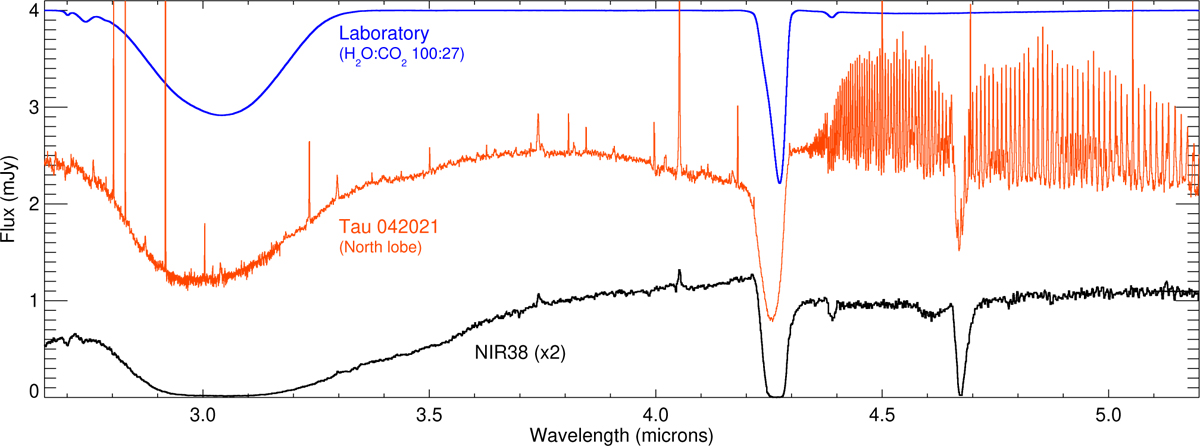
Band profiles comparison. The integrated NIRSpec spectrum from the north lobe of Tau 042021, in a sub-region unaffected by NIRSpec IFU masking to fully sample the profile, is shown in red (multiplied by 1.2). It is compared to a typical dense cloud spectrum (NIRCam + NIRSpec IFU, black, flux (multiplied by two) observed at high extinction in Chamaeleon I (McClure et al. 2023). Note the inversion in the shape for the CO2 ice band profile around 4.27 μm betraying differences in radiative transfer properties. A laboratory transmittance spectrum (blue) of a H2O:CO2 ice film mixture used in the optical constants determination in Dartois et al. (2024) has been converted to flux scale for comparison. Spectra have been scaled to have similar optical depths in the ice absorption features in order to compare their profiles.
Current usage metrics show cumulative count of Article Views (full-text article views including HTML views, PDF and ePub downloads, according to the available data) and Abstracts Views on Vision4Press platform.
Data correspond to usage on the plateform after 2015. The current usage metrics is available 48-96 hours after online publication and is updated daily on week days.
Initial download of the metrics may take a while.