Fig. 14
Download original image
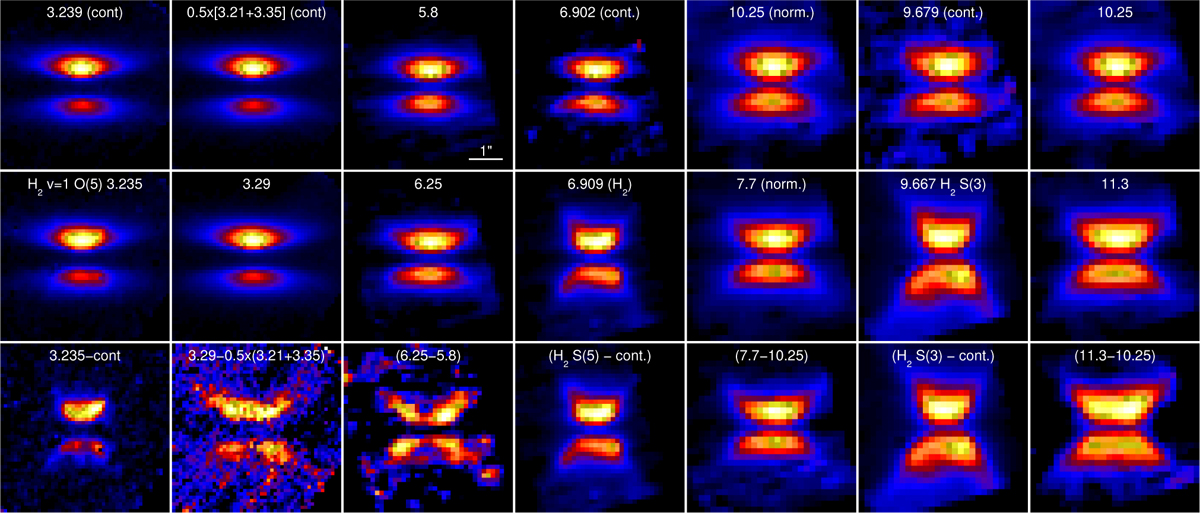
Series of images corresponding to the integration of the observed MIRI-MRS spectra over the newly built-in filters shown in Fig. 13. Each image has been normalised to its maximum intensity in order to clearly visualize the distributions of intensities. The first row corresponds to the ‘continuum filters’ distribution. The second (middle) row contains images of the astronomical PAH bands of interest (3.29, 6.25, 7.7, 11.3 μm) and H2 (6.909, 9.667 μm) emission lines. The lowest row shows the intensity in bands of interest once subtracted by the adjacent continuum reference intensity, then also normalised to observe the intensity distributions. The upper row shows intensity distributions with globally rounded lobes, whereas each band corresponding to an astronomical PAH band shows a more or less pronounced X shape. The width and opening angle for this X shape are larger than those observed for the H2 emission lines tracing the H2 wind, the latter being more ‘nested’ within this astronomical PAH band X shape.
Current usage metrics show cumulative count of Article Views (full-text article views including HTML views, PDF and ePub downloads, according to the available data) and Abstracts Views on Vision4Press platform.
Data correspond to usage on the plateform after 2015. The current usage metrics is available 48-96 hours after online publication and is updated daily on week days.
Initial download of the metrics may take a while.