Fig. 13
Download original image
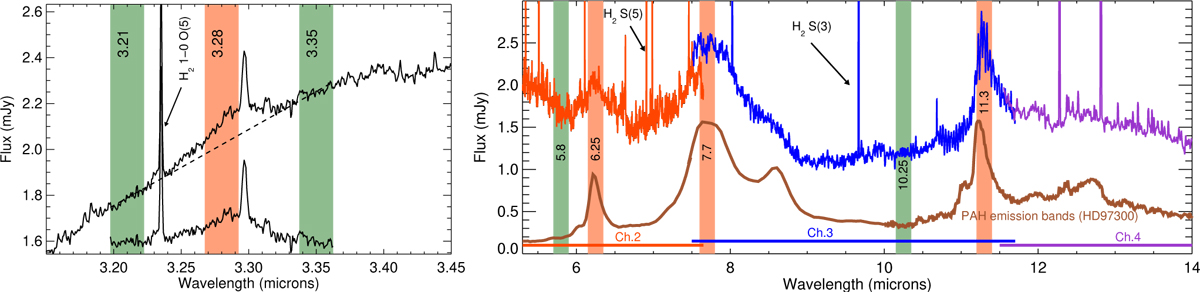
Left panel: NIRSpec-IFU spectrum in the region covering the CH stretching mode of astronomical PAH bands. Highlighted as filled regions (orange, green) are the wavelength spans corresponding to the different spectrophotometric filters we applied for our analysis. Green filters serve as continuum references to determine the continuum to be subtracted from the orange filter, which covers the astronomical PAH feature at 3.28 μm, while excluding the adjacent Pfund δ H emission line. Right panel: MIRI-MRS spectrum in each observed channel (Ch2 red, Ch3 blue, Ch4 purple). Highlighted as filled regions (orange, green) are the wavelength spans corresponding to the different spectrophotometric filters we applied for our analysis, and corresponding to specific bands of interest in the spectrum. The orange filters are tailored to measure the main emission bands contributing to the astronomical PAH bands. The green filters are reference wavelengths to record potential contributions from the adjacent astronomical PAH-free continuum. Overplotted in brown is the Spitzer spectrum of HD 97300 which displays a similar astronomical PAH bands contribution.
Current usage metrics show cumulative count of Article Views (full-text article views including HTML views, PDF and ePub downloads, according to the available data) and Abstracts Views on Vision4Press platform.
Data correspond to usage on the plateform after 2015. The current usage metrics is available 48-96 hours after online publication and is updated daily on week days.
Initial download of the metrics may take a while.