Fig. 11
Download original image
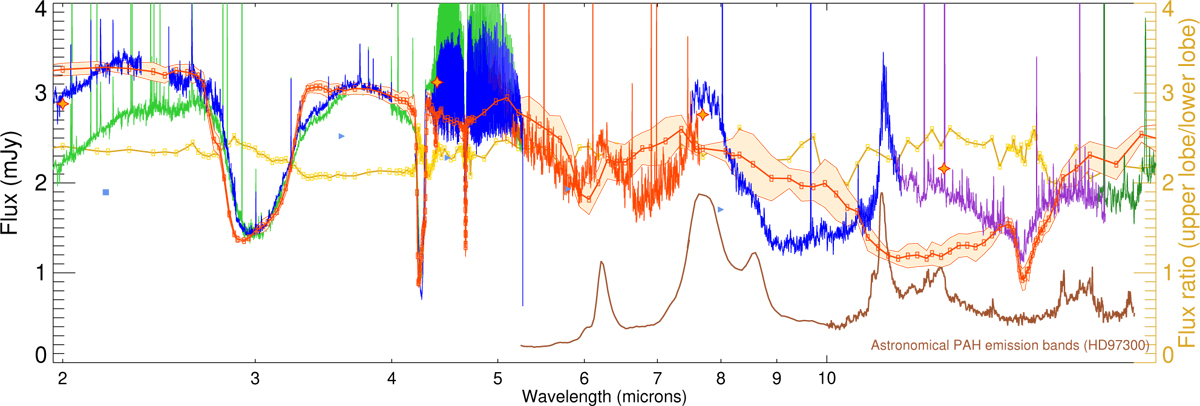
Zoom of the benchmark model spectrum (orange) and estimated uncertainties on the calculation (light orange filled region) in the JWST spectral range, overplotted on the NIRSpec-MIRI combined spectrum. The astronomical PAHs emission from the HD 97300 disc is shown in order to delineate the regions where such features contribute to the spectrum (these emission features are not explicitly included in the model).
Current usage metrics show cumulative count of Article Views (full-text article views including HTML views, PDF and ePub downloads, according to the available data) and Abstracts Views on Vision4Press platform.
Data correspond to usage on the plateform after 2015. The current usage metrics is available 48-96 hours after online publication and is updated daily on week days.
Initial download of the metrics may take a while.