Fig. 1
Download original image
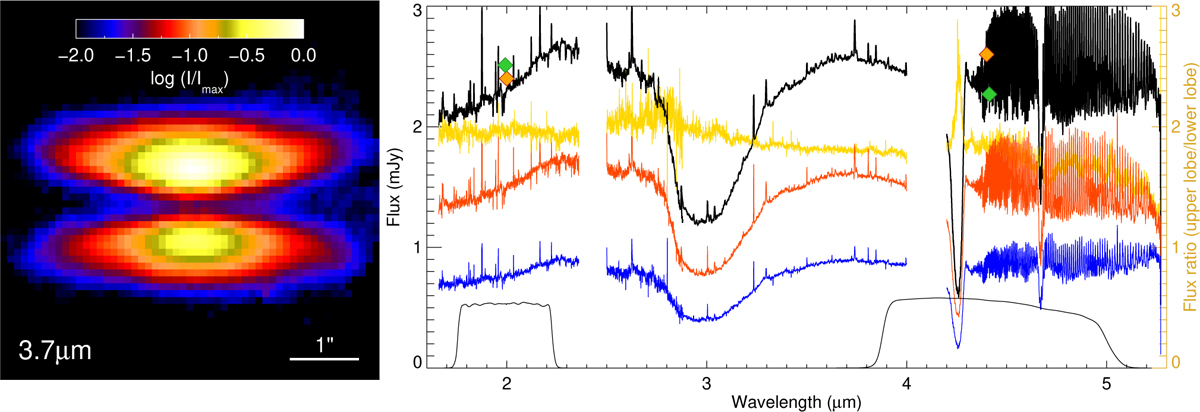
NIRSpec observations of Tau 042021. Left: illustrative photometric image at 3.7 μm, showing the overall structure of the disc in continuum emission flux. Right: NIRSpec spectra of Tau 042021. The total flux integrated over both lobes is shown in black. The individual contributions of the upper emission lobe (red) and lower lobe (blue) are shown. The upper-to-lower lobe flux ratio is shown in gold. The ratio generally lies at around 2 across the continuum, whereas in some parts of the profile of the absorption bands, the lower lobe is more extinct than the upper. Some gaps in the spectra are due to the corresponding ‘gaps’ in the NIRSpec observations at some wavelengths. The photometry from NIRCam images presented in Duchêne et al. (2024) are shown in orange (the corresponding filter shapes for the NIRCam filters F200W and F444W are shown below in black). The corresponding photometry obtained by integrating the spectra over the same filter profiles from our work are shown in green.
Current usage metrics show cumulative count of Article Views (full-text article views including HTML views, PDF and ePub downloads, according to the available data) and Abstracts Views on Vision4Press platform.
Data correspond to usage on the plateform after 2015. The current usage metrics is available 48-96 hours after online publication and is updated daily on week days.
Initial download of the metrics may take a while.