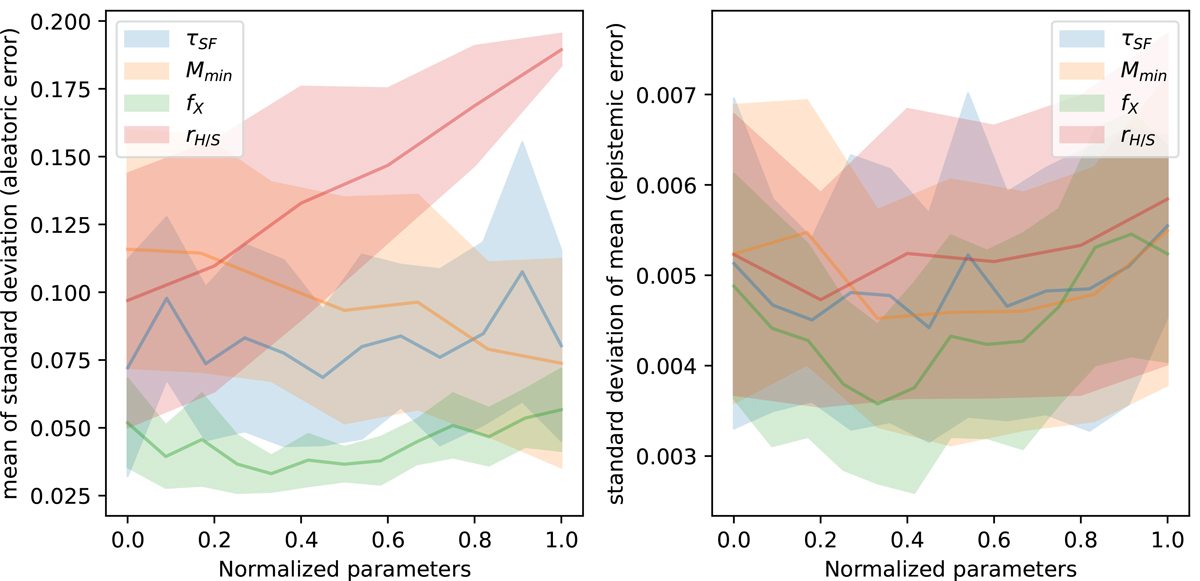
Fig. 8.
Download original image
Left: Mean standard deviation of the predicted distributions of each parameter by the BNN. For a single example, the mean was obtained by averaging the predicted means over 100 forward-passes (shown as solid lines), and the vertical width of the shaded regions show the dispersion of the results across the validation set. This quantifies the aleatoric uncertainty (i.e. the uncertainty caused by the noise in the data). Right: Standard deviation of the predicted means. This is the epistemic uncertainty (i.e. the error caused by the sparsity of the training sample). It is an order of magnitude smaller than the aleatoric uncertainty, indicating that the instrumental noise is the dominant source of variance.
Current usage metrics show cumulative count of Article Views (full-text article views including HTML views, PDF and ePub downloads, according to the available data) and Abstracts Views on Vision4Press platform.
Data correspond to usage on the plateform after 2015. The current usage metrics is available 48-96 hours after online publication and is updated daily on week days.
Initial download of the metrics may take a while.