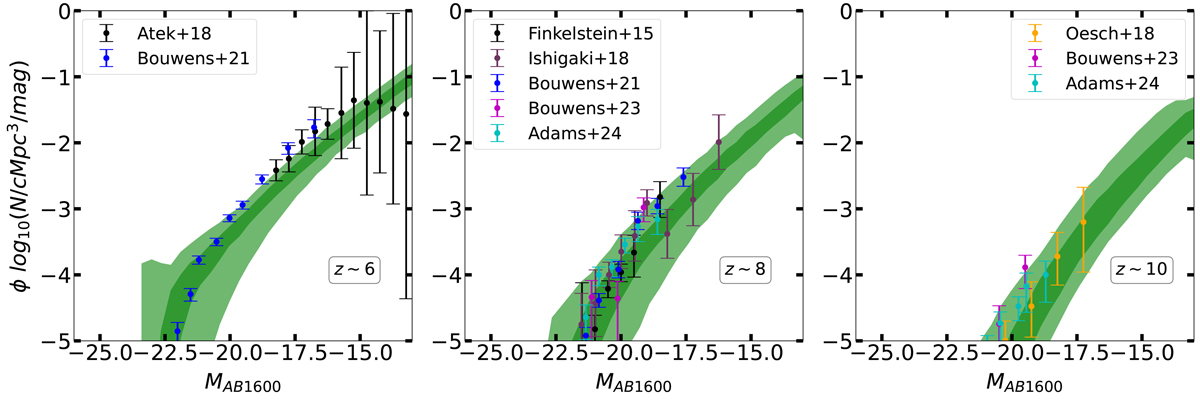
Fig. 2.
Download original image
UV luminosity functions of the LORELI II simulations at z ∼ 6, 8, 10. The dark green region shows, for each magnitude bin, where the middle 50% of the simulations lie, while the light green region shows where all simulations lie. We compare the simulated results with observations from Finkelstein et al. (2015), Oesch et al. (2018), Ishigaki et al. (2018), Atek et al. (2018), Bouwens et al. (2021, 2023).
Current usage metrics show cumulative count of Article Views (full-text article views including HTML views, PDF and ePub downloads, according to the available data) and Abstracts Views on Vision4Press platform.
Data correspond to usage on the plateform after 2015. The current usage metrics is available 48-96 hours after online publication and is updated daily on week days.
Initial download of the metrics may take a while.