Open Access
Fig. 13.
Download original image
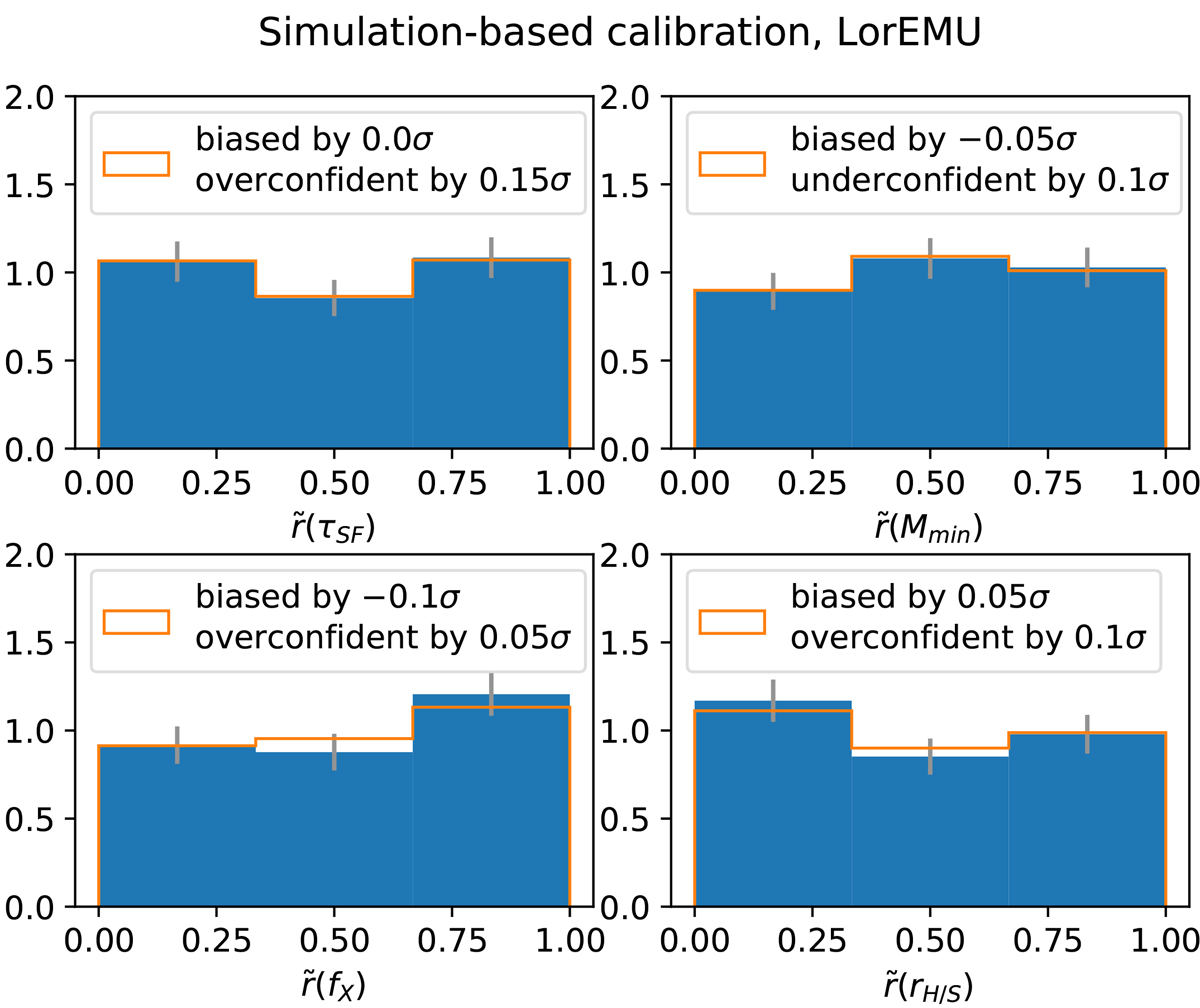
Distributions of ![]() for 980 inferences done with the stacked emulator (blue). We interpret the non-flatness of the histogram by identifying it with the histogram we would obtain with a Gaussian toy model (orange). The error bars indicate the standard deviation of each bin.
for 980 inferences done with the stacked emulator (blue). We interpret the non-flatness of the histogram by identifying it with the histogram we would obtain with a Gaussian toy model (orange). The error bars indicate the standard deviation of each bin.
Current usage metrics show cumulative count of Article Views (full-text article views including HTML views, PDF and ePub downloads, according to the available data) and Abstracts Views on Vision4Press platform.
Data correspond to usage on the plateform after 2015. The current usage metrics is available 48-96 hours after online publication and is updated daily on week days.
Initial download of the metrics may take a while.