Fig. 6.
Download original image
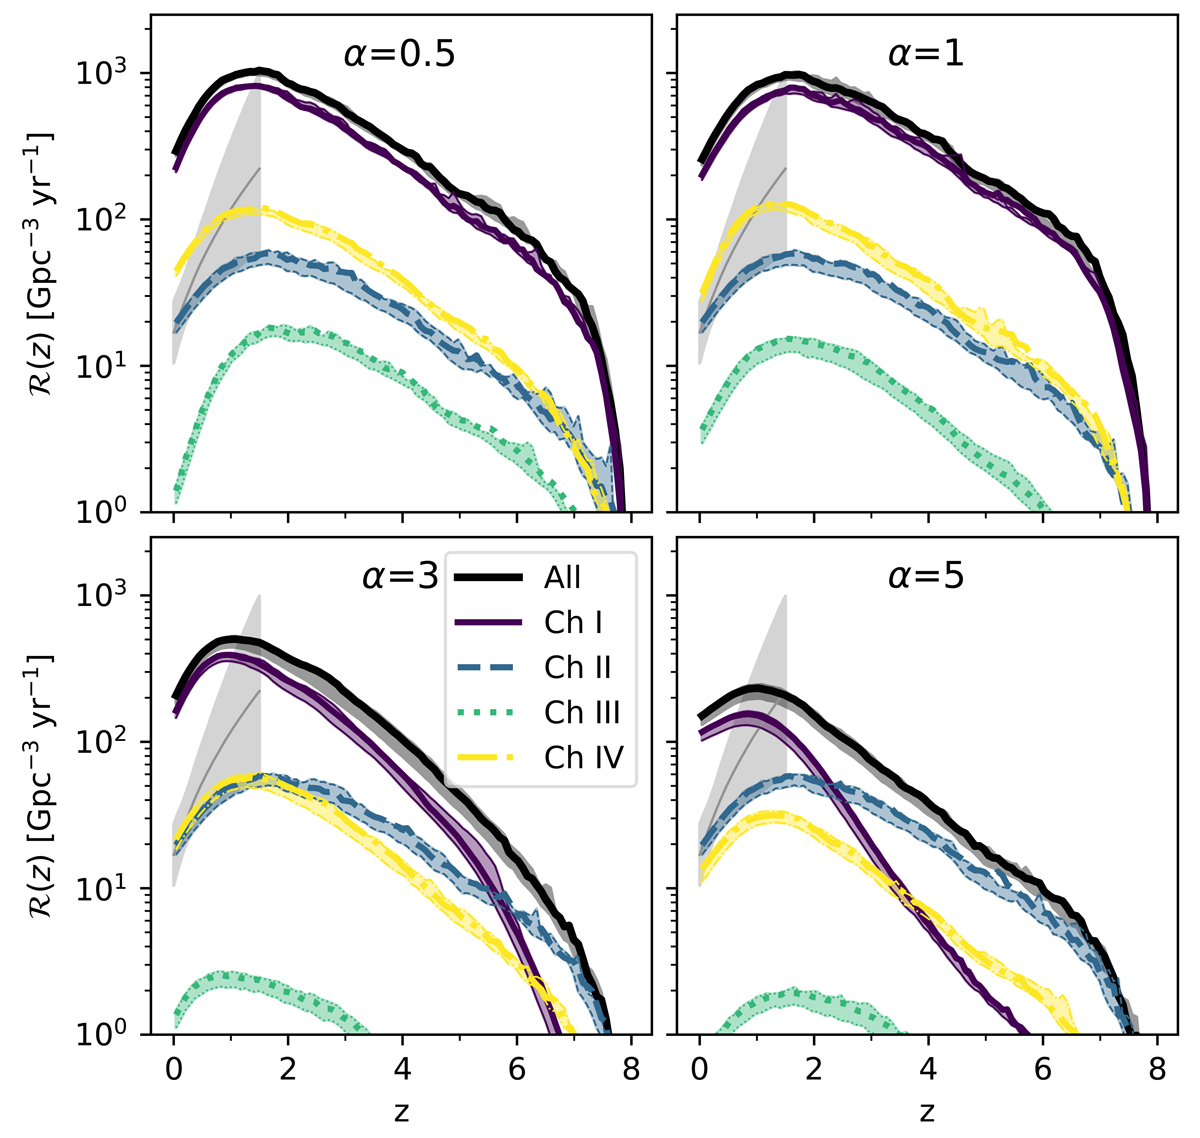
BBH merger rate density as a function of redshift for different BBH formation channels. The solid black lines show the merger rate density of the whole BBH population. The shaded area encompasses the difference between Mmin = 106 M⊙ (upper boundary), and Mmin = 108 M⊙ (lower boundary). The different panels show the results obtained assuming different CE α parameters. All the models assume the fiducial SFR–M* relation P23 and the fundamental metallicity relation by Andrews & Martini (2013). The gray-shaded regions show the MRD inferred by the LVK collaboration (Abbott et al. 2023b).
Current usage metrics show cumulative count of Article Views (full-text article views including HTML views, PDF and ePub downloads, according to the available data) and Abstracts Views on Vision4Press platform.
Data correspond to usage on the plateform after 2015. The current usage metrics is available 48-96 hours after online publication and is updated daily on week days.
Initial download of the metrics may take a while.