Fig. 3.
Download original image
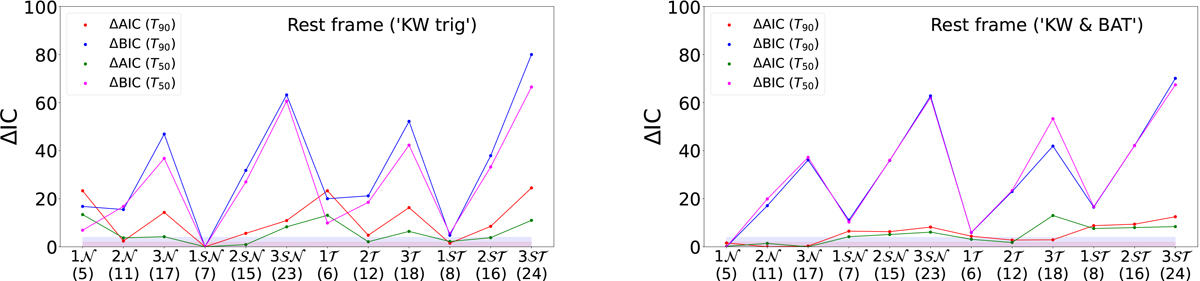
Comparison of information criteria scores computed using the T50 and T90 durations for the ‘KW trig’ and ‘KW & BAT’ samples. The following designations are introduced for the models: 𝒩 (𝒮𝒩) and 𝒯 (𝒮𝒯) denote the symmetric (skewed) Gaussian and Student distributions, correspondingly; the number to the left of the model provides the amount of clusters; and the number in parentheses gives the amount of free parameters of the model. The red filled area corresponds to the ΔIC < 2 area, while the blue filled area marks the 2 < ΔIC < 4 area.
Current usage metrics show cumulative count of Article Views (full-text article views including HTML views, PDF and ePub downloads, according to the available data) and Abstracts Views on Vision4Press platform.
Data correspond to usage on the plateform after 2015. The current usage metrics is available 48-96 hours after online publication and is updated daily on week days.
Initial download of the metrics may take a while.