Open Access
Fig. B.1.
Download original image
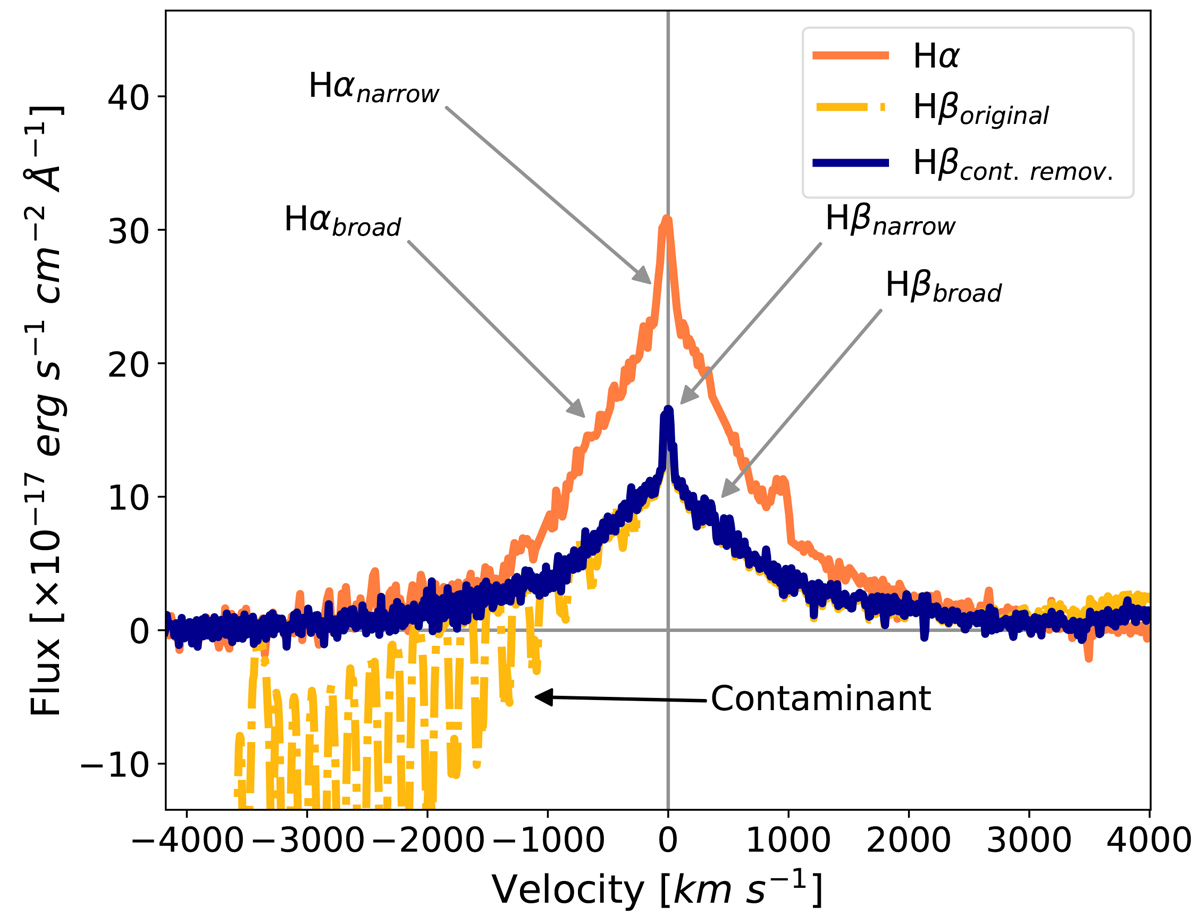
Comparison between Hβ (in blue for the corrected profile, and in dotted-yellow for the contaminated one) and Hα (in orange) in the X-shooter spectrum. The gray arrows refer to the broad and narrow components of Hβ and Hα. The black arrow stresses the position of the telluric absorption.
Current usage metrics show cumulative count of Article Views (full-text article views including HTML views, PDF and ePub downloads, according to the available data) and Abstracts Views on Vision4Press platform.
Data correspond to usage on the plateform after 2015. The current usage metrics is available 48-96 hours after online publication and is updated daily on week days.
Initial download of the metrics may take a while.