| Issue |
A&A
Volume 698, June 2025
|
|
|---|---|---|
| Article Number | A21 | |
| Number of page(s) | 13 | |
| Section | Planets, planetary systems, and small bodies | |
| DOI | https://doi.org/10.1051/0004-6361/202451869 | |
| Published online | 26 May 2025 | |
Dust-void evolution driven by turbulent dust flux can induce runaway migration of Earth-mass planets
1
Charles University, Faculty of Mathematics and Physics, Astronomical Institute.
V Holešovičkách 747/2,
180 00
Prague 8,
Czech Republic
2
Instituto de Ciencias Físicas, Universidad Nacional Autonoma de México. Av. Universidad s/n,
62210
Cuernavaca, Mor.,
Mexico
3
Theoretical Division, Los Alamos National Laboratory,
Los Alamos,
NM
87545,
USA
4
Department of Space Studies, Southwest Research Institute,
1050 Walnut St., Suite 300,
Boulder,
CO
80302,
USA
★ Corresponding author: This email address is being protected from spambots. You need JavaScript enabled to view it.
Received:
12
August
2024
Accepted:
27
March
2025
Abstract
Torques from asymmetric dust structures (so-called dust-void and filamentary structures) formed around low-mass planets embedded in a nonturbulent dust-gas disk can exceed the torques produced by the gas disk component and then go on to dominate the planet’s orbital dynamics. Here, we investigate how these structures (hence the dust torque) change when the effect of turbulent dust diffusion and dust feedback are included, along with the direct implications on the migration of Earth-like planets. Using the FARGO3D code, we performed 2D and 3D multifluid hydrodynamic simulations, focusing on a non-migrating planet with a mass of Mp = 1.5 M⊕ in 2D and on migrating planets with Mp ∈ [1.5, 12] M⊕ in 3D. We varied the δ-dimensionless diffusivity parameter in the range [0, 3 × 10⁻³] and considered three different Stokes numbers, St = {0.04, 0.26, 0.55}, which are representative of the gas-dominated, the transitional, and the gravity-dominated regimes, respectively. In our 2D models, we find that turbulent diffusion of dust prevents the formation of the dust-void and filamentary structures when δ > 3 × 10⁻⁴. Otherwise, dust structures survive turbulent diffusion flow. However, dust and total torques become positive only in transitional and gravity-dominated regimes. In our 3D models, we find that the dust-void is drastically modified and the high-density ring-shaped barrier delineating the dust-void disappears if δ ≳ 10−4, due to the effect of dust turbulent diffusion along with the back-reaction of the dust. For all values of δ, the filament in front of the planet is replaced by a low-density trench. Remarkably, as we have allowed the planets to migrate, the evolving dust-void can drive either runaway migration or outward (inward) oscillatory-torque migration. Our study thus suggests that low-mass Earth-like planets can undergo runaway migration in dusty disks.
Key words: protoplanetary disks / planet-disk interactions
© The Authors 2025
 Open Access article, published by EDP Sciences, under the terms of the Creative Commons Attribution License (https://creativecommons.org/licenses/by/4.0), which permits unrestricted use, distribution, and reproduction in any medium, provided the original work is properly cited.
This article is published in open access under the Subscribe to Open model. This email address is being protected from spambots. You need JavaScript enabled to view it. to support open access publication.
1 Introduction
It has been well established that protoplanetary disks are composed of gas and a small fraction of dust, with a mass of about 1% of the total mass of the gas (e.g., Armitage 2024). However, a clear picture of the dynamics of these constituents has not yet emerged. For instance, there is still no general consensus on the possible mechanism that gives rise to the redistribution of angular momentum in protoplanetary disks. Over the last century, numerous efforts have been made to solve this problem. Currently, two mechanisms are considered as possible candidates to explain the transport of angular momentum in protoplanetary disks (see Turner et al. 2014; Lesur et al. 2023, for a review): (i) turbulence parameterized by a dimensionless α-parameter (Shakura & Sunyaev 1973), which can be driven by different sources (e.g., magnetorotational instability (MRI; Balbus & Hawley 1991), hydrodynamic instabilities such as the Rossby wave instability (RWI; Lovelace et al. 1999; Li et al. 2000, 2001), or the vertical shear instability (VSI; Arlt & Urpin 2004)); or (ii) magnetized disk winds (MDW; Blandford & Payne 1982).
In the frame of angular momentum transport driven by turbulence, the dynamics of the gas and dust in a protoplanetary disk are implicitly linked by the value of the α-parameter, since a non-zero value of α generates a certain level of turbulence in the gas which in turn induces turbulent diffusion (i.e., stirring) of the dust through the action of drag forces (Youdin & Lithwick 2007). Nevertheless, it is important to mention that dust coupling to gas turbulence can lead to diffusion (Chen & Lin 2020) and anti-diffusion (i.e., dust clumping, see e.g., Johansen et al. 2007). Both processes can affect the formation of planets (e.g., Venturini et al. 2020). Indeed, turbulent dust diffusion can prevent dust accumulation in regions of a protoplanetary disk where density or pressure gradients are at work.
With all the above in mind, we are interested in studying the effects of turbulent dust diffusion on planetary migration. In recent 2D numerical studies, where dust diffusion was not taken into account, it has been proposed that nonsymmetric dusty structures may arise in the vicinity of a planet (Benítez-Llambay & Pessah 2018; Regály 2020; Guilera et al. 2023; Chrenko et al. 2024). The so-called dust-void and dust filament structures (regions of low and high dust density, respectively) can produce a total torque on the planet that in many cases (depending on the Stokes number, St, of the dust and on the dust-to-gas mass ratio, ϵ), is positive and therefore leads to an outward migration for low-mass planets (0.3 ≤ Mp ≤ 10 M⊕, with M⊕ the Earth mass).
In this work, we examine the effect of turbulent dust diffusion on the density distribution of dust around a low-mass planet through multifluid simulations. In particular, we wish to analyse the formation of the dust-void and filament under the action of the turbulent diffusion of dust. We began with 2D models, similar to those considered by Benítez-Llambay & Pessah (2018), to quantify the change in the torque exerted on the planet when dust can diffuse. Subsequently, we investigate the possible implications of 3D dust distributions on planetary migration. We did so by performing 3D multifluid simulations, parameterizing the dust sedimentation through the δ-diffusion coefficient (Morfill & Voelk 1984; Weber et al. 2019). Overall, this study is aimed at determining whether the formation of a 3D dust-void and a filament structure are possible and whether gravitational torques are affected.
The paper is laid out as follows. In Sect. 2, we describe the physical model of a dust-gas disk. The code and numerical setups used in our 2D and 3D multifluid simulations are provided in Sect. 3. In Sect. 4, we show the results of our 2D numerical models on the dust-void destruction due to turbulent dust diffusion. The dust-void morphology obtained from 3D simulations and the effects on the migration of a low-mass planet are presented in Sects. 5 and 6. Finally, a brief discussion and our conclusions are given in Sect. 7.
2 Physical model
In this section, we describe different components of our physical model, including turbulent dust diffusion and the back-reaction of dust on gas employed in this study.
2.1 Governing equations
We considered a 3D, non-self-gravitating gas-dust disk whose evolution is governed by the following equations:
![Mathematical equation: $\[\partial_t \rho_{\mathrm{g}}+\nabla \cdot\left(\rho_{\mathrm{g}} \mathbf{v}\right)=0,\]$](/articles/aa/full_html/2025/06/aa51869-24/aa51869-24-eq1.png) (1)
(1)
![Mathematical equation: $\[\partial_t\left(\rho_{\mathrm{g}} \mathbf{v}\right)+\nabla \cdot\left(\rho_{\mathrm{g}} \mathbf{v} \otimes \mathbf{v}+p \mathbf{l}\right)=-\rho_{\mathrm{g}} \nabla \Phi+\nabla \cdot \tau-\mathbf{f}_{\mathrm{d}},\]$](/articles/aa/full_html/2025/06/aa51869-24/aa51869-24-eq2.png) (2)
(2)
![Mathematical equation: $\[\partial_t \rho_{\mathrm{d}}+\nabla \cdot\left(\rho_d \mathbf{u}+\mathbf{j}_{\mathrm{d}}\right)=0,\]$](/articles/aa/full_html/2025/06/aa51869-24/aa51869-24-eq3.png) (3)
(3)
![Mathematical equation: $\[\partial_t\left(\rho_{\mathrm{d}} \mathbf{u}\right)+\nabla \cdot\left(\rho_{\mathrm{d}} \mathbf{u} \otimes \mathbf{u}\right)=-\rho_{\mathrm{d}} \nabla \Phi+\mathbf{f}_{\mathrm{d}},\]$](/articles/aa/full_html/2025/06/aa51869-24/aa51869-24-eq4.png) (4)
(4)
where ρg, ρd, v, and u denote the gas density, dust density, gas velocity, and the dust velocity, respectively. Furthermore, Φ denotes the gravitational potential, | is the unit tensor, and p is the gas pressure. For the latter, we consider the locally isothermal equation of state:
![Mathematical equation: $\[p=c_s^2 \rho_{\mathrm{g}},\]$](/articles/aa/full_html/2025/06/aa51869-24/aa51869-24-eq5.png) (5)
(5)
where cs is the isothermal sound speed. Note that the sound speed is kept constant, namely, we did not include an energy equation. Consequently, the aspect ratio of the gas disk, hg, remains constant. The aspect ratio of the dust, hd, is initially set as a constant (Eq. (22)), at t = 0.
To mimic the turbulence in the gaseous component, we included a viscous stress tensor in the right-hand side (RHS) of the Eq. (2), whose 3D form can be expressed as
![Mathematical equation: $\[\tau=\rho_{\mathrm{g}} \nu\left[\nabla \mathbf{v}+(\nabla \mathbf{v})^{\mathrm{T}}-\frac{2}{3}(\nabla \cdot \mathbf{v}) \mathrm{l}\right],\]$](/articles/aa/full_html/2025/06/aa51869-24/aa51869-24-eq6.png) (6)
(6)
where v is the gas kinematic viscosity, parameterized through the usual Shakura & Sunyaev (1973) description
![Mathematical equation: $\[\nu=\alpha c_s H_{\mathrm{g}}.\]$](/articles/aa/full_html/2025/06/aa51869-24/aa51869-24-eq7.png) (7)
(7)
In the equation above, Hg is the pressure scale height of the gas in the disk, defined as Hg = cs/ΩKep where ΩKep is the Keplerian angular frequency. It is important to note that the α-parameter, apart from playing a role in the dynamics of the gas, also affects the dynamics of the dust because it generates a constraint on dust diffusion, as we describe below.
2.2 Dust diffusion flux
To take into account the possible effect of gas turbulence on the dust dynamics, in the dust mass conservation equation (see Eq. (3)), we include the gradient in the dust concentration through the vector jd, given as (for details, see Morfill & Voelk 1984):
![Mathematical equation: $\[\mathbf{j}_{\mathrm{d}}=-D_{\mathrm{d}}\left(\rho_{\mathrm{g}}+\rho_{\mathrm{d}}\right) \nabla\left(\frac{\rho_{\mathrm{d}}}{\rho_{\mathrm{g}}+\rho_{\mathrm{d}}}\right).\]$](/articles/aa/full_html/2025/06/aa51869-24/aa51869-24-eq8.png) (8)
(8)
The quantity Dd is the dust diffusion coefficient, which is related to gas turbulence through the Schmidt number
![Mathematical equation: $\[\mathrm{Sc}=\frac{\nu}{D_{\mathrm{d}}},\]$](/articles/aa/full_html/2025/06/aa51869-24/aa51869-24-eq9.png) (9)
(9)
which quantifies the relative effectiveness of the gas angular momentum transport and the dust-mixing processes. In this study, we consider Sc = 1, since we are analyzing a dust fluid with a Stokes number below unity (see Youdin & Lithwick 2007). Note that although both diffusive coefficients (v and Dd) have a common origin in the turbulence in the disk (and in this particular case, they are even equal), they describe different physical processes. Therefore, in order to differentiate these two quantities, we chose to use the dimensionless diffusivity parameter
![Mathematical equation: $\[\delta=\frac{D_{\mathrm{d}}}{c_s H_{\mathrm{g}}},\]$](/articles/aa/full_html/2025/06/aa51869-24/aa51869-24-eq10.png) (10)
(10)
which is analogous to the dimensionless α-parameter.
2.3 Dust back-reaction force
In Eqs. (2) and (4), the last term on the RHS is the drag force term given as
![Mathematical equation: $\[\mathbf{f}_{\mathrm{d}}=\frac{\Omega_{\mathrm{Kep}}}{\mathrm{St}} \rho_{\mathrm{d}}(\mathbf{v}-\mathbf{u}),\]$](/articles/aa/full_html/2025/06/aa51869-24/aa51869-24-eq11.png) (11)
(11)
where St is a dimensionless measure of the dust-gas coupling that relates to the dust grain properties via
![Mathematical equation: $\[\mathrm{St}=\sqrt{\frac{\pi}{8}} \frac{r_{\mathrm{m}} \rho_{\mathrm{m}} \Omega}{\rho_{\mathrm{g}} c_s},\]$](/articles/aa/full_html/2025/06/aa51869-24/aa51869-24-eq12.png) (12)
(12)
where rm is the grain size and ρm is the material density of the dust. Note that the effect of the feedback force term given in Eq. (11) becomes more relevant in 3D disk models, where dust settling leads to large concentrations of dust at the midplane of the disk.
3 Multifluid hydrodynamical simulations
To numerically solve Eqs. (1)–(4), we used the publicly available hydrodynamic code FARGO3D1 (Benítez-Llambay & Masset 2016; Benítez-Llambay et al. 2019) with an implementation of the fast orbital advection algorithm (FARGO; Masset 2000) used in our 2D models, along with the new implementation of the rapid advection algorithm on arbitrary meshes (RAM; Benítez-Llambay et al. 2023) employed in our 3D simulations.
In both 2D and 3D multifluid simulations, the dust density profile is initialized from the gas density using the constant dust-to-gas mass ratio, ϵ, and composed of separate fluids with Stokes numbers of St = 0.04, 0.26 and St = 0.55 at r0 = 1. These Stokes numbers fall into the gas-dominated, transitional, and gravity-dominated regimes, respectively (see cases a), b) and c) analyzed in Benítez-Llambay & Pessah 2018). Although for small values of the Stokes number and gas viscosity (hence, for small values of δ, such as 10−4 used here), the feedback may be ineffective, when St approaches unity the feedback can produce significant changes in the radial velocity of the gas (Kanagawa et al. 2017). Therefore, to get an idea of the effect of turbulent dust diffusion on the dust structures around of the planet, in case c) we did not include the feedback.
3.1 Setup of 2D simulations
Our 2D numerical simulations were carried out following the framework of Benítez-Llambay & Pessah (2018) (see their Sect. 2), which, in turn, is based on the gas-dust disk model of Weber et al. (2018); only with the two major differences in the disk model mentioned above: we included the effect of the back-reaction of the dust on the gas and the diffusion of the dust. The effects of these two processes, neglected in the study of Benítez-Llambay & Pessah (2018), are presented in Sect. 4. Below, we briefly recall some aspects of the initial conditions.
The 2D multifluid equations (i.e., 2D version of the set of Eqs. (1)–(4)) are solved on a polar grid centred on to the star and in a frame co-rotating with the planet of orbital radius, rp. The surface density of the gas disk is chosen to be a power law of r:
![Mathematical equation: $\[\Sigma_g(r)=\Sigma_0\left(\frac{r}{r_p}\right)^{-\sigma},\]$](/articles/aa/full_html/2025/06/aa51869-24/aa51869-24-eq13.png) (13)
(13)
with Σ0 = 2 × 10⁻³/π in code units (which corresponds to ≈ 200gcm−2 in cgs units at rp = 5.2 au) and a surface density slope of σ = 1/2. The temperature decays as a power law of the radius, as well, with a slope of β = 1. We use hg = 0.05 and consider α ∈ [0, 3 × 10⁻³]. The dust density profile is initialized from Σg, using the constant dust-to-gas mass ratio ϵ = Σd/Σg = 0.01.
The gravitational potential Φ is composed of the gravitational potential of the star, the planet, and the indirect term (arising from non-inertial forces, i.e., the second term on the RHS in Eq. (19)). Additionally, in the gravitational potential of the planet, we applied a softening length, rsm, equal to the planet Hill radius, rH = rp(Mp/3M⋆)1/3 (here, Mp and M⋆ are the planet and star masses, respectively) to avoid numerical issues. Note that the value of rsm, for the low-mass planets considered in this work, is significantly smaller than the value required in a gaseous disk to produce an approximate agreement between 2D and 3D torques (e.g., Tanaka & Okada 2024); whereas it is comparable to or larger than the thickness of the dusty disk. This entails that we overestimate the gaseous torque and underestimate the dusty torque, so that our statements about the importance of the dusty torque are conservative. We applied the same cut-off of the torque inside the Hill sphere and we also considered the same smoothing length as in Benítez-Llambay & Pessah (2018) for comparison purposes, since our objective is to describe the effects of diffusion and feedback on dust distribution. However, we are aware that this dust distribution is sensitive to the choice of the smoothing length in 2D (Regály 2020; Guilera et al. 2023), whose value is not well-determined (for a detailed discussion see Chrenko et al. 2024; Hou & Yu 2025).
Unless otherwise specified, the planet has a mass of Mp = 1.5 M⊕ and is held on a fixed circular orbit around a star of a mass of M⋆ = 1 M⊙. We modeled the entire ring of a disk (2π in azimuth) with a radial extent between r = 0.48 and r = 2.08, considering Nr = 3130 and Nϕ = 12 288 radial and azimuthal uniform grid zones, respectively.
3.2 3D disk simulations
The setup of our 3D model is based on the gaseous disk of Masset & Benítez-Llambay (2016, as described in their Appendix A). We used spherical coordinates (r, θ, ϕ), where r is the radial distance from the star, θ is the polar angle (![Mathematical equation: $\[\theta=\frac{\pi}{2}\]$](/articles/aa/full_html/2025/06/aa51869-24/aa51869-24-eq14.png) at the midplane of the disk), and ϕ is the azimuthal angle. The aspect ratio of the gas disk is hg = Hg/r. The gas disk density is given by
at the midplane of the disk), and ϕ is the azimuthal angle. The aspect ratio of the gas disk is hg = Hg/r. The gas disk density is given by
![Mathematical equation: $\[\rho_{\mathrm{g}}=\rho_{\mathrm{g}}^{\mathrm{eq}}(\sin \theta)^{-\beta-\xi+h_{\mathrm{g}}^{-2}},\]$](/articles/aa/full_html/2025/06/aa51869-24/aa51869-24-eq15.png) (14)
(14)
with
![Mathematical equation: $\[\rho_{\mathrm{g}}^{\mathrm{eq}}=\frac{\Sigma_0}{\sqrt{2 \pi} h_{\mathrm{g}} r_p}\left(\frac{r}{r_p}\right)^{-\xi},\]$](/articles/aa/full_html/2025/06/aa51869-24/aa51869-24-eq16.png) (15)
(15)
where Σ0 is the surface density at r = rp. We set β = 1, ξ = 1.5 and hg = 0.05 in all models considered here. We initialize the gas velocity components as follows: vr = vθ = 0 and
![Mathematical equation: $\[v_\phi=\sqrt{\frac{G M_{\star}}{r \sin \theta}-\xi c_s^2}.\]$](/articles/aa/full_html/2025/06/aa51869-24/aa51869-24-eq17.png) (16)
(16)
The gravitational potential Φ is given by
![Mathematical equation: $\[\Phi=\Phi_S+\Phi_p,\]$](/articles/aa/full_html/2025/06/aa51869-24/aa51869-24-eq18.png) (17)
(17)
where
![Mathematical equation: $\[\Phi_S=-\frac{G M_{\star}}{r},\]$](/articles/aa/full_html/2025/06/aa51869-24/aa51869-24-eq19.png) (18)
(18)
and
![Mathematical equation: $\[\Phi_p=-\frac{G M_p}{\sqrt{r^{\prime 2}+r_{\mathrm{sm}}^2}}+\frac{G M_p r ~\cos~ \left(\phi-\phi_p\right) ~\sin~ \theta}{r_p^2}\]$](/articles/aa/full_html/2025/06/aa51869-24/aa51869-24-eq20.png) (19)
(19)
represent the stellar and planetary potentials, respectively. In Eq. (19), r′ = |r − rp| is the cell-planet distance, with the planet located at ![Mathematical equation: $\[\left(r_{p}, \theta_{p}, \phi_{p}\right)=\left(1, \frac{\pi}{2}, 0\right)\]$](/articles/aa/full_html/2025/06/aa51869-24/aa51869-24-eq21.png) and rsm is softening length of the planet’s potential. The second term on the right-hand side of Eq. (19) is the indirect term arising from the reflex motion of the star. Our simulations were performed with rsm = 0.05Hg, which is comparable to twice the cell size of our numerical grid (we carried out other experiments with a larger rsm and found similar results). In our 3D models, no cut-off of the torque is applied inside the Hill sphere.
and rsm is softening length of the planet’s potential. The second term on the right-hand side of Eq. (19) is the indirect term arising from the reflex motion of the star. Our simulations were performed with rsm = 0.05Hg, which is comparable to twice the cell size of our numerical grid (we carried out other experiments with a larger rsm and found similar results). In our 3D models, no cut-off of the torque is applied inside the Hill sphere.
Since dust grains above the midplane are not pressure-supported, the vertical gravitational force drives their settling on a timescale that is much shorter than that of viscous gas evolution. Consequently, the scale heights of dust and gas can be different (hd ≠ hg). Therefore, we considered an initial dust density profile that depends on the dust pressure scale hd, such that
![Mathematical equation: $\[\rho_{\mathrm{d}}=\rho_{\mathrm{d}}^{\mathrm{eq}}(\sin \theta)^{-\beta-\xi+h_{\mathrm{d}}^{-2}}\]$](/articles/aa/full_html/2025/06/aa51869-24/aa51869-24-eq22.png) (20)
(20)
and
![Mathematical equation: $\[\rho_{\mathrm{d}}^{\mathrm{eq}}=\epsilon \frac{\Sigma_0}{\sqrt{2 \pi} h_{\mathrm{d}} r_0}\left(\frac{r}{r_p}\right)^{-\xi}.\]$](/articles/aa/full_html/2025/06/aa51869-24/aa51869-24-eq23.png) (21)
(21)
In Eq. (21), the initial dust-to-gas mass ratio ϵ is such that Σd/Σg = 0.01. The dust pressure scale is defined through the dimensionless diffusivity parameter δ as
![Mathematical equation: $\[h_{\mathrm{d}}=h_{\mathrm{g}} \sqrt{\frac{\delta}{\delta+\mathrm{St}}}.\]$](/articles/aa/full_html/2025/06/aa51869-24/aa51869-24-eq24.png) (22)
(22)
The radial and vertical components of the dust velocity are both zero initially, whereas the azimuthal component is set to start from a Keplerian rotation profile. Contrary to the 2D models, the planet is allowed to migrate in all of our 3D simulations. To include the aerodynamic back-reaction (feedback) from the dust on the gas (cases with St = 0.04 and St = 0.26), we performed simulations using two fluids at a time (gas plus one dust species).
3.2.1 Computational grid
Due to the computational cost of 3D multifluid simulations, to achieve a numerical resolution similar to that used in the 2D models (see Sect. 3.1), we used the Fargo3D code with the RAM module. This module allows us to use a nonuniform mesh, with smaller cells near the planet (Benítez-Llambay et al. 2023). This approach helps to increase the resolution around the dust-depleted region at a more affordable computational cost. The numerical grid covers the disk region [rmin, rmax] = [0.48rp, 2.08rp] in the radial directions, ![Mathematical equation: $\[\left[\theta_{\min }, \theta_{\max }\right]=\left[\frac{\pi}{2}-h_{p}, \frac{\pi}{2}\right]\]$](/articles/aa/full_html/2025/06/aa51869-24/aa51869-24-eq25.png) , in co-latitude (we only simulated one hemisphere of the disk and assumed symmetry in the other). The azimuthal extent is [ϕmin, ϕmax] = [−π, π], covering the whole extent of the disk.
, in co-latitude (we only simulated one hemisphere of the disk and assumed symmetry in the other). The azimuthal extent is [ϕmin, ϕmax] = [−π, π], covering the whole extent of the disk.
Under this numerical scheme, the bumps in the radial and azimuthal mesh functions (see Appendix B in Benítez-Llambay et al. 2023) are parameterized by considering the constants a = 0.2618, b = 0.3141 to model the resolution transitions, and with c = 1.5 and c = 15 for the radial and azimuthal resolution contrast between the two levels, respectively. The vertical resolution and spacing were chosen on the basis of the dust aspect ratio (see Eq. (22)). When hd ≥ 0.1hg, we used a uniform grid with constant resolution in the polar direction. Setting the number of grid cells as (Nr, Nθ, Nϕ) = (1864, 100, 1864) leads to cube-sized cells Δr = rpΔθ = rpΔϕ = 5 × 10⁻⁴ at the planet’s position. We also note that the grid attains a resolution of H/100. Otherwise, if hd < 0.1hg, we used a mesh density function in the polar direction, whose resolution ratio is specified in Appendix A.
3.2.2 Boundary conditions
We used boundary conditions for each dust species similar to those implemented for the density and velocity components of the gas (see Chametla & Masset 2021, for details). We used damping boundary zones, as in de Val-Borro et al. (2006), with the width of the inner and outer damping rings being 0.15rp and 0.5rp, respectively. The damping timescale at the edge of each ring is equal to 0.3 of the local orbital period. We emphasize that the radial extension of the domain is large enough to avoid any disturbances from the disk boundaries affecting the dust-void region. Any perturbations found in this region are therefore purely a result of the dynamic interaction between the gas, dust, and the planet. Additionally, we used damping zones only in the radial direction because their inclusion in the vertical direction would drastically modify dust settling and might lead to an overly large dust-to-gas mass ratio in the midplane. Lastly, since we consider only one hemisphere of the disk here, we used reflecting boundary conditions at the midplane.
4 Destruction of the 2D dust-void in a gaseous turbulent disk
In this section, we describe how the 2D dust density structures near a Mp = 1.5 M⊕ planet change when the effects of turbulent diffusion and dust feedback are included. For the purpose of maintaining a clearer notation throughout this study, we omit stating the value of α when δ is specified because these parameters are identical.
4.1 Effect of turbulent dust diffusion
To gain insight into the effect of turbulent dust diffusion, we first present the results of the models with St = 0.55, where the dust feedback on the gas is neglected and the influence of the turbulent flow diffusion can be isolated more clearly.
In Fig. 1, we show the relative perturbation of dust density and the dust streamlines around the planet in the case of a Stokes number of St = 0.55 and six different values of δ, calculated at t = 50 orbits. When δ = 0, a dust-void structure appears behind the planet, this feature is encircled by a high-density ring-shaped region, while in front of the planet a filamentary structure is formed. Looking at the other panels, we find that the dust-void structure and the dust filament undergo minor modifications for values of δ < 3 × 10⁻⁴.
As the viscosity and turbulent dust diffusion increase, the distribution of dust around the planet is altered. When δ ≥ 3 × 10⁻⁴, the size of the dust-void is reduced and the filament in front of the planet starts to vanish. Given a diffusivity parameter value of δ = 3 × 10⁻³, we find that neither the dust-void structure nor the filament form. This last case deserves particular attention since Benítez-Llambay & Pessah (2018) reported the formation of the dust-void and filament for the gas viscosity α = 3 × 10⁻³ (and δ = 0; see their Figure 1).
This result is noteworthy because the value of α used by Benítez-Llambay & Pessah (2018) is actually comparable with recent estimates of turbulence levels inferred from observed disks (Flaherty et al. 2020; Jiang et al. 2024). Therefore, turbulence dust diffusion can be critically important in these situations. It should be emphasized that we recovered the same structure as case c) reported in Benítez-Llambay & Pessah (2018) when we considered α = δ = 0, that is, in a dusty gaseous disk without turbulence (see top-left panel of Fig. 1).
The trend appearing in Fig. 1 can be understood as a competition between two antagonic processes. The distribution of the dust results from its advection (an inward drift and a horseshoe U-turn) and diffusion due to its interaction with the turbulent gas. The dust settles into a pattern whose characteristics depend on the timescale for diffusion (which tends to fill the dust-void) and that of advection (which tends to result in a dust-void). When the timescale for the former is short enough, namely, when δ is sufficiently large, the dust-void is suppressed.
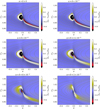 |
Fig. 1 Relative perturbation of dust density for a Stokes number St = 0.55 (representative of the gravity-dominated regime), generated by an Earth-mass planet (Mp = 1.5 M⊕). The solid gray lines show the dust streamlines. All images are shown for a time of t = 50 orbits. It should be noted that when the dust diffusion is not included (upper left panel), the formation of the dust-void behind the planet and the dust filament in front of the planet exhibit the same structure, as reported in Fig. 1 (case c), of Benítez-Llambay & Pessah (2018). However, when dust diffusion increases, the dust-void and filament eventually disappear (see bottom-right panel). |
4.2 Lengthening and weakening of high-density dust-void barrier: Dust back-reaction force effect
Similarly, for a Stokes number St = 0.26 (transitional regime not shown here), we find again that the dust-void and the filament structure begin to disappear for δ ≥ 3 × 10⁻⁴ and are absent when δ ≃ 3 × 10⁻³. We emphasize that when the dust-void and filament structures are maintained, which happens for δ < 3 × 10⁻⁴, their shape and extension resemble those found in the gravity-dominated regime. In other words, the radius of the ring-shaped high-density structure that delimits the dust-void increases as the diffusivity parameter decreases. Dust from the surroundings cannot penetrate this region because of aerodynamic friction by the gas and scattering by the planet. Additionally, we find that the high-density filament in front of the planet becomes more prominent as the parameter δ is reduced.
In general, the explanation for the widening of the dust-void and the elongation of the filamentary structure lies in the fact that the feedback and the turbulent diffusion of the dust incidentally conspire to counteract the scattered dust flow generated by the planet. That is to say, turbulent diffusion produces a spreading of the ring-shaped structure, but due to the dispersion produced by the planet, the dust tends only to diffuse away from the planet. However, because the dust exerts a drag force on the gas, the pressure of the gas increases in the region where the dust has moved to, generating a new pressure maximum that prevents the dust located at the outer edge of the ring from escaping. This results in a ring-shaped structure with a larger radius. A similar effect occurs in the filament in front of the planet: while turbulent diffusion tries to spread the dust, the scattering generated by the planet forces the dust to move away from it, but the feedback counteracts it, leading to an elongation of the structure in question.
For the case when the dust is strongly coupled to the gas (case St = 0.04, i.e., gas-dominated regime), we find that the dust-void and filament structures are drastically modified compared to the case when turbulent dust diffusion and dust feedback are discarded (see first and second panels in Fig. 3). For the case of δ = 0, the dust barrier delimiting the dust-void is dragged toward the edges of the gas horseshoe region, where there may be vortices propagating because the gas disk is inviscid (since α = 0). A similar effect occurs in the dust filament formed in front of the planet, since some of the dust approaching the filament from upstream is carried toward the edge of the horseshoe region (see second panel in Fig. 3). Therefore, the dust-void is left unprotected, which leads to a shallower dust-void and the dust filament is weakened.
Lastly, if there is a non-zero turbulent diffusion of the dust, the blurring of the dust-void and the filament is stronger and they are completely erased when δ = 3 × 10⁻³ (see lower panel in Fig. 3).
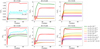 |
Fig. 2 Temporal evolution of the dust (top row) and total (bottom row) torques on a planet of mass Mp = 1.5 M⊕ for representative cases of the gas-dominated (left), transitional (middle) and gravity-dominated (right) regimes. |
4.3 Impact of the dust-void on the planet’s torque
An immediate consequence of the dust-void and filamentary structures not surviving turbulent dust diffusion is reflected in the torque that the dust exerts on the planet. In the case of a gravity-dominated regime (St = 0.55, without feedback), unlike Benítez-Llambay & Pessah (2018), we find that the dust torque on the planet is negative when α = 3 × 10⁻³. Note that the total torque is also negative (see the third column in Fig. 2). For a lower level of gas turbulence (which implies a lower value of δ), the dust torque becomes less negative and it is possible to obtain a null total torque when δ ≃ 3 × 10⁻⁴. Reducing the diffusivity further, we find that for δ < 3 × 10⁻⁴, the total torque on the planet is always positive. This latter result is relevant in regimes of low turbulence in the gas of protoplanetary disks (e.g., Pinte et al. 2016; Lesur et al. 2023; Jiang et al. 2024), as it entails that planetary migration can be directed outward.
In the case of the transitional regime (St = 0.26, with feedback included), due to the broadening and lengthening of the dust-void and filament, respectively, we find similar values of the dust torque as in the gravity-dominated regime. For instance, we refer to cases with δ = 10−4 and δ = 3 × 10⁻³ of the second and third columns in Fig. 2. However, it is worth mentioning that in the interval of 3 × 10⁻⁴ ≤ δ ≤ 10−3, the dust torque is negative for St = 0.26, which differs from the behavior of the torque in the gravity-dominated regime over the same range of δ values (where the dust torque is positive and its magnitude increases when δ → 0; see Fig. 2).
Finally, it is important to note that when the barrier of the dust-void is broken or destroyed, which occurs in the case of the gas-dominated regime (St = 0.04), the dust torque is positive only for very small values of the δ-parameter (~10−5). Therefore, even in the presence of fine dust, the total torque on the planet is negative.
5 3D dust-void morphology
Here, we focus on the results of the 3D multifluid simulations. In addition to the case of Mp = 1.5 M⊕ considered in Sect. 4, we extended our analysis toward more massive planets. Additionally, we let the planets migrate instead of keeping them on fixed orbits.
5.1 Dust-void destruction
In Fig. 4, we show the relative perturbation of dust density around a planet of Mp = 1.5 M⊕ at the midplane of the disk for the gas-dominated regime (St = 0.04). We have chosen three different values of the dust turbulent diffusion δ = 10−5, 10−4, and 3 × 10⁻³ as reference cases, allowing us to reveal the main differences in the dust density distribution, as compared to 2D models.
When δ = 10−5, the dust-void starts to show a shape resembling its 2D counterpart. However, the ring-shaped high-density structure at the edge of the dust-void is spread out, mainly due to the effect of turbulent dust diffusion. Note that even though the feedback effect is less efficient in this case because the dust is initially confined to a very thin layer (hd ≪ hg), there is a sufficient contribution from this to maintain dust accumulation, thereby leading to a process similar to that explained in the Sect. 4.2. Also, the ring-shaped high-density structure exhibits perturbations characteristic of an epicyclic motion when r > rp (see Morbidelli & Nesvorny 2012). Additionally, we find that the filament in front of the planet is erased and a trench emerges in its place.
In the case of δ = 10−4, the dust-void forms again but, unlike the 2D dust-void (see Figs. 1 and 3), it exhibits low central density and is no longer delimited by a ring-shaped barrier of high density. Additionally, the trench and the epicyclic oscillations (in both structures) arise as for δ = 10−5. Note that the edges of the dust-void and trench are wider compared to those of the ring-shaped barrier and filament regions of the 2D models. This is likely a consequence of turbulent dust diffusion, which spreads out dust density gradients.
Lastly, when δ = 3 × 10⁻³, the size of the dust-void and the trench are considerably reduced, which means that both structures are filled by “fresh” dust. Seen from another perspective, dust scattering is only efficient very close to the planet, resulting in a negligible dust-void and shallower trench. The absence of the dust-void and filamentary structures for δ = 3 × 10⁻³ is similar in both 2D and 3D models (see bottom panels in Figs. 3 and 4).
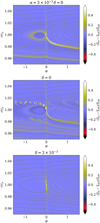 |
Fig. 3 2D dust-void structure for three different values of δ in the gas-dominated regime (St = 0.04), for a planet with Mp = 1.5 M⊕. Top: case without dust turbulent diffusion in a viscous gas disk, which is similar to the case a) studied in Benítez-Llambay & Pessah (2018, their figure 1). Middle: case of an inviscid gaseous disk (α = 0) without dust turbulent diffusion (δ = 0). Bottom: dust-void and filament are destroyed for δ = 3 × 10⁻³. Snapshots at t = 50 orbits. |
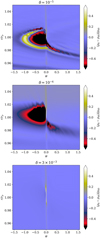 |
Fig. 4 3D dust-void structure for three different values of δ in the gas-dominated regime (St = 0.04), for a planet with Mp = 1.5M⊕. Top: snapshot (calculated at t = 70 orbits) in the case of δ = 10−5. A low-density trench forms in front of the planet instead of a filament. Middle: case with δ = 10−4. The dust-void structure resembles the shape found in 2D simulations but without the high-density ring-shaped barrier. Bottom: dust-void and filament disappearing for δ = 3 × 10⁻³ (snapshot calculated at t = 100 orbits). |
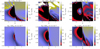 |
Fig. 5 Relative perturbation of dust density at the midplane of the disk for α = δ = 10−4 (top) and α = δ = 3 × 10⁻³ (bottom) calculated at t = 100 orbits. Three different planetary masses in the transitional regime (St = 0.26) are considered (see the labels of individual panels). Note: the planet is located at the center of each plot. |
5.2 Deformation and pollution of the dust-void for planets with a higher mass
Next, we analyzed the evolution of dust structures in 3D disks when the mass of the planet increases. For this proposal, we ran a set of simulations with Mp = 3, 6 and 12 M⊕. We set the Stokes number to St = 0.26.
In Fig. 5, we show the results of these numerical experiments. The relative perturbation of dust density at the midplane for a planet with Mp = 3 M⊕ exhibits a well-defined structure for the dust-void and the filament, for both values of the dust diffusion coefficients. However, a detailed inspection of the δ = 10−4 case shows that the filament becomes a trench that connects directly to the dust-void. Another interesting feature is the overdense stripes adjacent to the dust-void and the trench in front of it. This dust pattern may be a consequence of buoyancy resonances (Chametla et al., in prep.) since an isothermal dusty gaseous disk behaves like an adiabatic pure gaseous disk (Lin & Youdin 2017), in which the buoyancy resonances produce a similar stripe-like pattern in gas (see Ziampras et al. 2023, and references therein).
For a planet of Mp = 6 M⊕, when δ = 10−4, the trench in front of the planet opens up enough to cover a considerable region compared to the dust-void, which in turn becomes polluted with material orbiting at r > rp. Otherwise, the dust-void and the trench structures are well defined when δ = 3 × 10⁻³. That is to say, there is no material entering the dust-void region and the width of the trench does not increase as in the previous, lower mass case. Lastly, for the most massive planet considered in this study (i.e., Mp = 12 M⊕) and a value of δ = 10−4, we find again that the trench in front of the planet widens and it also contains some filaments of dust within it. Interestingly, an overdense island forms within the dust-void, which survives until the end of the simulation. However, at a larger turbulent dust diffusion δ = 3 × 10⁻³, the dust-void remains clear and the trench is divided from the dust-void by a very thin filament that emerges from the planet position.
6 Runaway and oscillatory migration driven by the dust-void evolution
6.1 Runaway migration signature
The runaway migration of planets in a gas disk (without dust component) is a self-sustaining mechanism with short migration time-scales ≤O(102) orbits (Masset & Papaloizou 2003) and it applies mainly to super-Earth, sub-Jovian, and Jupitertype planets (Masset & Papaloizou 2003; Pepliński et al. 2008a,b,c; Lin & Papaloizou 2010; Paardekooper 2014). The main engine of the gas-driven runaway migration is a non-linear corotation torque maintained by the change in the fluid elements’ orbital radius executing U-turns at the end of horseshoe orbits. This torque scales with the rate of migration of the planet and with the vorticity-weighted coorbital mass deficit, δm (Masset & Papaloizou 2003). In the high-mass regime, whose deficit essentially corresponds to a coorbital mass deficit, which is proportional to the difference between the surface density trapped in the coorbital region and that of the orbit-crossing flow, while in the low mass regime, it essentially amounts to a jump of vortensity between the horseshoe region and the surrounding disk (Paardekooper 2014; McNally et al. 2018).
In the first regime, two necessary conditions for runaway migration to occur in a gaseous disk are that the planet creates a partial gap and that the mass deficit δm ≈ Mp. However, note the masses of the planets (Mp ∈ [1.5, 12] M⊕) considered in this study are not large enough to satisfy both conditions simultaneously. Therefore, the migration of these low-mass planets in a gas disk must fall within the type I migration regime (see Chametla et al. 2023, and references therein). As a proof of this last argument, in the upper panel of Fig. 6 we show the temporal evolution of the semimajor axis of a planet with Mp = 1.5 M⊕ obtained from a 3D dust-free model. Clearly, the planet’s semimajor axis, a, does not change in a runaway fashion; rather, it varies at a constant rate over the first 150 orbital periods, as in the type I migration regime over small orbital displacements.
The situation can be much different when a planet migrates in a dusty gaseous disk. We first analyze the migration for the case of Mp = 1.5 M⊕ and St = 0.55. In the bottom panel of Fig. 6, it can be seen that the semimajor axis of the planet changes considerably over a period of time that is less than a hundred orbital periods. The latter suggests that the planet is experiencing a runaway migration. To confirm this hypothesis, Fig. 7 shows the temporal evolution of the planet’s drift rate when the planet is embedded in a gas and gaseous-dusty disk with δ = 10−4 and δ = 3 × 10⁻³, respectively. Clearly, the drift rate of the planet migrating in a gaseous-dusty disk is higher and varies considerably over the first orbital periods, even if the semimajor axis itself does not vary significantly during that short time frame.
It should be noted that while the first points in Fig. 7 show a systematic increase in the migration velocity over time, characteristic of a runaway migration, it tends toward an asymptotic value over a time comparable to the libration time, τlib ≡ 4πa/(3/2)Ωxs (with xs half-width of horseshoe region); here, on the order of 60–70 orbits. The first phase corresponds to a runaway migration; whereas in the final stage, migration settles into a type III regime. Also note that the velocity at which migration saturates in type III is the relative velocity between the planet and the dust. Since dust (especially St = 0.55) migrates rapidly inward (ur ~ −1 × 10⁻³), the planet’s inward migration must be faster for the feedback to be broken. This suggests that the drift rate is not a function of the semimajor axis only, but also of the drift rate itself, as occurs in runaway migration. Note that the drift rate in a gaseous disk is constant which is to be expected due to the behavior of the planet’s semimajor axis (see upper panel in Fig. 6).
6.2 Planetary drift rate as oscillatory-torque migration trace in dusty gaseous disks
We return to the analysis of the migration in the cases when St = 0.04 and St = 0.26, as shown in the second and third panels of Fig. 6 for a planet of Mp = 1.5 M⊕. Except for the case of δ = 3 × 10⁻³ in the gas-dominated regime (St = 0.04), which exhibits a almost stagnant oscillating migration, we found that in these models the behavior of the semimajor axis is far from type I migration and in turn does not change as quickly while maintaining the same direction as in the case of runaway migration found in the gravity-dominated regime.
A detailed inspection of each of the semimajor axes shows a migration with several changes of direction in short time compared to the dynamical timescale, which resembles stochastic migration (Nelson & Papaloizou 2004; Nelson 2005; Baruteau & Lin 2010). However, it is important to emphasize that there is no global turbulence on the dust distribution. The changes in migration are mainly due to deflection and deformation of the dust-void and the trench, respectively, producing an oscillatory behavior in the torque felt by the planet.
Note that due to the time over which the 3D multifluid simulations are run, a convergence study of the running time-averaged torque is beyond the scope of this work. Therefore, we henceforth prefer to adopt the term “oscillatory-torque migration” to refer to such changes in planetary migration, rather than stochastic migration.
Remarkably, for planets with a larger mass (Mp ∈ {3, 6, 12} M⊕) in the transitional-dominated regime (St = 0.26) also we find an oscillatory-torque migration. Figure 8 shows the temporal evolution of the semimajor axis, the migration rate, and the eccentricity for these models. In the first column of Fig. 8, it can be seen that the temporal evolution of the planet’s semimajor axis exhibits frequent oscillations within an orbital period for both values of dust turbulent diffusion. However, there appears to be a marked trend with respect to the mass of the planet, since for δ = 10−4, as the mass of the planet increases, migration goes from outward to inward migration. On the other hand, for δ = 3 × 10⁻³, even when the mass of the planet increases, the migration is directed outwards.
As a proof of oscillatory behavior in planet migration, in the second column of Fig. 8 we show the drift rate of these planets with a larger mass. In these plots we have included the sign of the drift rate, since if there are mixed positive and negative values over the dynamical time it means that the planet experiences episodes of oscillatory migration. In all cases, we find positive and negative values in the drift rate of the planet. However, particular attention must be paid to the case of Mp = 6 M⊕ and δ = 3 × 10⁻³, we find that for t ≤ 70 orbital periods, the semimajor axis grows rapidly in a runaway fashion. We also observe that the sign of the drift rate does not change on this time interval. Therefore, this suggests that for this particular case, the planet first experiences a runaway migration and subsequently an oscillatory-torque migration.
Lastly, in the third column of Fig. 8, we show the temporal evolution of the eccentricity. It can be seen that although there is an oscillatory behavior, there is also a marked increasing tendency for the eccentricity in almost all models. Except in the case when Mp = 12 M⊕ and δ = 10−4 where there is an inward oscillatory-torque migration scenario. Interestingly, these results suggest that an outward oscillatory-torque migration inevitably results in the development of planetary eccentricity.
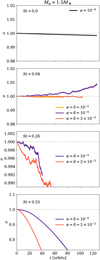 |
Fig. 6 Temporal evolution of the semimajor axis of a planet with Mp = 1.5 M⊕ embedded in a purely gaseous 3D disk (top) and in 3D dusty disks representative of the gas-dominated, transitional, and gravity-dominated regimes ((second, third, and bottom panel, respectively). |
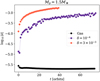 |
Fig. 7 Temporal evolution of the migration rate |
![Mathematical equation: $\[\dot{a}\]$](/articles/aa/full_html/2025/06/aa51869-24/aa51869-24-eq26.png)
6.3 Triggering oscillatory-torque migration
As we describe above, a planet migrating in a disk of gas and dust can experience either a runaway migration or an oscillatorytorque migration. Both types of migration are governed by the level of turbulent diffusion and feedback of the dust which shapes the structure of the dust-void and the trench. For instance, in the gas-dominated regime (St = 0.04) when δ = 10−5, the dust-void is partially surrounded by broken ring-shaped high-density structure and the trench shows an elongated pattern (see Fig. 4). These features lead to an inward oscillatory-torque migration. On the other hand, for δ = 10−4, we find that the dust-void and the trench feature survive, driving an outward oscillatory-torque migration. Finally, for δ = 3 × 10⁻³, the dust-void and the trench are significantly weakened and the planet experiences a nearly stagnant oscillatory-torque migration.
Furthermore, in the case of St = 0.55 (gravity-dominated regime), where the back-reaction force of the dust on the gas is not included, we find that the dust-void and the trench maintain a well-defined shape, resulting in an inward runaway migration for both values of δ = 10−4 and δ = 3 × 10⁻³, respectively. Therefore, it appears from the models described above that the outcome of the runaway migration is mainly governed by the evolution of the dust-void. In fact, unless the dust-void is deformed or populated with dust islands, runaway migration occurs. Otherwise, any modification of the dust-void inevitably results in an oscillatory-torque migration.
7 Discussion and conclusions
In this work, we report the results of 2D and 3D multifluid hydrodynamics simulations, including dust turbulent diffusion, aerodynamic dust feedback, and planet migration (in the 3D case). Our aim was to determine how the inclusion of aforementioned effects changes the so-called dust-void and filament dust structures formed behind and in front of low-mass planets.
The importance of analyzing the possible effects of turbulent dust diffusion and feedback on these structures in the dust lies in the fact that Benítez-Llambay & Pessah (2018) recently showed that the asymmetric distribution of dust around low-mass planets embedded in 2D disks can produce a torque that dominates the other components of the gas torques (corotation and Lindblad torques). In a subsequent study, Guilera et al. (2023) quantified the impact due to the distribution of dust on the migration of the planets. However, in both studies, 2D laminar disks were considered, discarding the effect of turbulent diffusion of dust as well as the dust feedback. It is worth mentioning that in both studies the viscosity of the gas parameterized by the alpha coefficient was included, which was set to α = 3 × 10⁻³.
With this in mind, we started our study with 2D models for a low-mass planet (Mp = 1.5 M⊕) on a fixed circular orbit embedded in a dusty-gaseous disk following the same framework as in Benítez-Llambay & Pessah (2018). Nevertheless, here we have taken into account the turbulent dust diffusion (parameterized by δ ∈ [0, 3 × 10⁻³]) and the back-reaction force from the dust on the gas. We find that the dust-void and the filament are formed when δ ≲ 10−4. On contrary, higher levels of turbulent dust diffusion prevent the formation of structures around the planet, reducing the ability of dust-driven torques to cause outward migration.
Of course, there could be other factors contributing to the modification of the 2D dust-void apart from the turbulent diffusion and feedback of dust; for instance, the smoothing radius of the planet’s potential (Regály 2020) or the absence of pebble accretion (Chrenko et al. 2024). The first possibility, beyond its role as a physical variable, arises as a limitation of 2D numerical models since it is chosen ad hoc. Therefore, in order to obtain a more appropriate physical description of the evolution of the dust structures, a 3D numerical treatment is necessary.
Consequently, we included in our study 3D simulations of migrating planets with Mp ∈ [1.5, 12] M⊕ (which also includes the representative case analyzed in the 2D models). These simulations reveal that the morphology of the dust-void and the filament depends strongly on the turbulent dust diffusion as well as on the inclusion of feedback. The changes in the dust structures can be summarized as follows:
- ■
In the case of smaller values of dust turbulent diffusion, δ < 10−4, the dust-void is drastically modified and the ring-shaped high-density structure surrounding it is weakened and scattered. Note that these structures still do not resemble the structures found at Benítez-Llambay & Pessah (2018), where neither turbulent dust diffusion nor feedback were included.
- ■
For a δ value of the order of ~10−4, the dust-void survives and its fate will simply depend on how much dust falls into the dust-void.
- ■
In the case of δ values larger than 10−4, the dust-void is almost filled for lowest mass planet and for larger masses, the dust-void decreases considerably.
- ■
Instead, for all values of δ, the high-density filament in front of the planet is replaced by a trench.
Remarkably, we find runaway migration or an outward (inward) oscillatory-torque migration driven by the dust-void evolution due to the gas feedback and turbulent dust diffusion. It must be emphasized that the evolution of the dust-void and trench depends on the δ value, the dust feedback, and (slightly) on the mass of the planet. Lastly, the direction of the runaway migration (inward or outward) depends on the evolution of the trench, which is intrinsically linked to the turbulent diffusion and feedback of the dust.
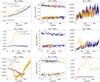 |
Fig. 8 Temporal evolution of the orbital parameters for the planets of larger mass migrating in a 3D dusty disk including δ = 10−4 and δ = 3 × 10⁻³ for the transitional regime with St = 0.26. Left. Semimajor axis a. Center. Migration rate |
![Mathematical equation: $\[\dot{a}\]$](/articles/aa/full_html/2025/06/aa51869-24/aa51869-24-eq27.png)
Acknowledgements
We thank the anonymous referee for his constructive and careful report, which significantly improved the quality of this manuscript. This work was supported by the Czech Science Foundation (grant 21-23067M). The work of O.C. was supported by the Charles University Research Centre program (No. UNCE/24/SCI/005). Computational resources were available thanks to the Ministry of Education, Youth and Sports of the Czech Republic through the e-INFRA CZ (ID: 90254).
Appendix A Vertical dust height resolution treatment
From Eq. (22), it follows that the vertical height of the dust depends on the Stokes number and the coefficient of turbulent diffusion of the dust. Therefore, we have that for the pair of values of (St, hd) = (0.04, 3 × 10⁻³) and (St, hd) = (0.55, 10−4) studied in our dusty gaseous disks, the aspect ratio of the dust takes the respective maximum and minimum values ![Mathematical equation: $\[h_{\mathrm{d}}^{\max}\]$](/articles/aa/full_html/2025/06/aa51869-24/aa51869-24-eq28.png) = 0.013 and
= 0.013 and ![Mathematical equation: $\[h_{\mathrm{d}}^{\min}\]$](/articles/aa/full_html/2025/06/aa51869-24/aa51869-24-eq29.png) = 6.7 × 10⁻⁴. This last value of hd is of the order of the resolution value with cube-sized cells Δr = rpΔθ = rpΔϕ = 5 × 10⁻⁴ at the planet position when a uniform mesh is used in the vertical component.
= 6.7 × 10⁻⁴. This last value of hd is of the order of the resolution value with cube-sized cells Δr = rpΔθ = rpΔϕ = 5 × 10⁻⁴ at the planet position when a uniform mesh is used in the vertical component.
To avoid possible numerical effects on the dust dynamics around the planet, for the resolution of vertical component of the computational mesh we have adopted two prescriptions: 1) a uniform vertical domain with a constant resolution Δθ = 5 × 10⁻⁴ and, 2) A non-uniform vertical domain where the resolution increases considerably for values of hd < 0.1hg such that, it is satisfied that hd/Δθ ≥ 10.68. In Fig. A.1 we show the resolution ratio at colatitude used in 2). Within the domain of the computational mesh between ![Mathematical equation: $\[\frac{\pi}{2}-0.01\]$](/articles/aa/full_html/2025/06/aa51869-24/aa51869-24-eq30.png) and
and ![Mathematical equation: $\[\frac{\pi}{2}\]$](/articles/aa/full_html/2025/06/aa51869-24/aa51869-24-eq31.png) , the resolution is kept constant. To maintain the aforementioned constraint, the number of zones, Nθ, is modified according to the value of hd in each model.
, the resolution is kept constant. To maintain the aforementioned constraint, the number of zones, Nθ, is modified according to the value of hd in each model.
We note that due to the high computational cost of our 3D models when increasing the number of zones in the vertical component of the grid, we have fixed the hd/Δθ ratio to a little more than ten grid cells for hd. Nevertheless, we think that it is a good compromise to keep this minimum value for the numerical resolution of hd. In Fig. A.2 we show the comparison of the temporal evolution of the semimajor axis of a planet with Mp = 3 M⊕ for the pair of parameters (St, hd) = (0.26, 10−4), applying both grid configurations. It is clear that the change is minimal between the two prescriptions of the vertical grid. Therefore, it is safe to adopt this vertical resolution ratio in description 2).
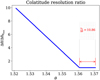 |
Fig. A.1 Colatitude resolution ratio for the models with a dust aspect ratio less than 0.1hg. Note: in the domain between |
![Mathematical equation: $\[\theta=\frac{\pi}{2}-0.01\]$](/articles/aa/full_html/2025/06/aa51869-24/aa51869-24-eq32.png)
![Mathematical equation: $\[\theta= \frac{\pi}{2}\]$](/articles/aa/full_html/2025/06/aa51869-24/aa51869-24-eq33.png)
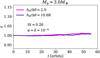 |
Fig. A.2 Comparison of the temporal evolution of the semimajor axis of a planet of mass Mp = 3.0M⊕ for α = δ = 10−4 and St = 0.26 using prescriptions 1) and 2) for the resolution of the grid in the vertical component (magenta and purple lines, respectively). |
References
- Arlt, R., & Urpin, V. 2004, A&A, 426, 755 [NASA ADS] [CrossRef] [EDP Sciences] [Google Scholar]
- Armitage, P. J. 2024, arXiv e-prints [arXiv:2412.11064] [Google Scholar]
- Balbus, S. A., & Hawley, J. F. 1991, ApJ, 376, 214 [Google Scholar]
- Baruteau, C., & Lin, D. N. C. 2010, ApJ, 709, 759 [NASA ADS] [CrossRef] [Google Scholar]
- Benítez-Llambay, P., & Masset, F. S. 2016, ApJS, 223, 11 [Google Scholar]
- Benítez-Llambay, P., & Pessah, M. E. 2018, ApJ, 855, L28 [Google Scholar]
- Benítez-Llambay, P., Krapp, L., & Pessah, M. E. 2019, ApJS, 241, 25 [Google Scholar]
- Benítez-Llambay, P., Krapp, L., Ramos, X. S., & Kratter, K. M. 2023, ApJ, 952, 106 [Google Scholar]
- Blandford, R. D., & Payne, D. G. 1982, MNRAS, 199, 883 [CrossRef] [Google Scholar]
- Chametla, R. O., & Masset, F. S. 2021, MNRAS, 501, 24 [Google Scholar]
- Chametla, R. O., Chrenko, O., Lyra, W., & Turner, N. J. 2023, ApJ, 951, 81 [NASA ADS] [CrossRef] [Google Scholar]
- Chen, K., & Lin, M.-K. 2020, ApJ, 891, 132 [Google Scholar]
- Chrenko, O., Chametla, R. O., Masset, F. S., Baruteau, C., & Brož, M. 2024, A&A, 690, A41 [NASA ADS] [CrossRef] [EDP Sciences] [Google Scholar]
- de Val-Borro, M., Edgar, R. G., Artymowicz, P., et al. 2006, MNRAS, 370, 529 [Google Scholar]
- Flaherty, K., Hughes, A. M., Simon, J. B., et al. 2020, ApJ, 895, 109 [NASA ADS] [CrossRef] [Google Scholar]
- Guilera, O. M., Benitez-Llambay, P., Miller Bertolami, M. M., & Pessah, M. E. 2023, ApJ, 953, 97 [NASA ADS] [CrossRef] [Google Scholar]
- Hou, Q., & Yu, C. 2025, ApJ, 979, 185 [Google Scholar]
- Jiang, H., Macías, E., Guerra-Alvarado, O. M., & Carrasco-González, C. 2024, A&A, 682, A32 [NASA ADS] [CrossRef] [EDP Sciences] [Google Scholar]
- Johansen, A., Oishi, J. S., Mac Low, M.-M., et al. 2007, Nature, 448, 1022 [Google Scholar]
- Kanagawa, K. D., Ueda, T., Muto, T., & Okuzumi, S. 2017, ApJ, 844, 142 [NASA ADS] [CrossRef] [Google Scholar]
- Lesur, G., Flock, M., Ercolano, B., et al. 2023, in Astronomical Society of the Pacific Conference Series, 534, Protostars and Planets VII, eds. S. Inutsuka, Y. Aikawa, T. Muto, K. Tomida, & M. Tamura, 465 [Google Scholar]
- Li, H., Finn, J. M., Lovelace, R. V. E., & Colgate, S. A. 2000, ApJ, 533, 1023 [NASA ADS] [CrossRef] [Google Scholar]
- Li, H., Colgate, S. A., Wendroff, B., & Liska, R. 2001, ApJ, 551, 874 [NASA ADS] [CrossRef] [Google Scholar]
- Lin, M.-K., & Papaloizou, J. C. B. 2010, MNRAS, 405, 1473 [NASA ADS] [Google Scholar]
- Lin, M.-K., & Youdin, A. N. 2017, ApJ, 849, 129 [NASA ADS] [CrossRef] [Google Scholar]
- Lovelace, R. V. E., Li, H., Colgate, S. A., & Nelson, A. F. 1999, ApJ, 513, 805 [NASA ADS] [CrossRef] [Google Scholar]
- Masset, F. 2000, A&AS, 141, 165 [NASA ADS] [CrossRef] [EDP Sciences] [Google Scholar]
- Masset, F. S., & Benítez-Llambay, P. 2016, ApJ, 817, 19 [NASA ADS] [CrossRef] [Google Scholar]
- Masset, F. S., & Papaloizou, J. C. B. 2003, ApJ, 588, 494 [NASA ADS] [CrossRef] [Google Scholar]
- McNally, C. P., Nelson, R. P., & Paardekooper, S.-J. 2018, MNRAS, 477, 4596 [Google Scholar]
- Morbidelli, A., & Nesvorny, D. 2012, A&A, 546, A18 [NASA ADS] [CrossRef] [EDP Sciences] [Google Scholar]
- Morfill, G. E., & Voelk, H. J. 1984, ApJ, 287, 371 [Google Scholar]
- Nelson, R. P. 2005, A&A, 443, 1067 [NASA ADS] [CrossRef] [EDP Sciences] [Google Scholar]
- Nelson, R. P., & Papaloizou, J. C. B. 2004, MNRAS, 350, 849 [NASA ADS] [CrossRef] [Google Scholar]
- Paardekooper, S. J. 2014, MNRAS, 444, 2031 [NASA ADS] [CrossRef] [Google Scholar]
- Pepliński, A., Artymowicz, P., & Mellema, G. 2008a, MNRAS, 386, 164 [Google Scholar]
- Pepliński, A., Artymowicz, P., & Mellema, G. 2008b, MNRAS, 386, 179 [Google Scholar]
- Pepliński, A., Artymowicz, P., & Mellema, G. 2008c, MNRAS, 387, 1063 [Google Scholar]
- Pinte, C., Dent, W. R. F., Ménard, F., et al. 2016, ApJ, 816, 25 [Google Scholar]
- Regály, Z. 2020, MNRAS, 497, 5540 [CrossRef] [Google Scholar]
- Shakura, N. I., & Sunyaev, R. A. 1973, A&A, 24, 337 [NASA ADS] [Google Scholar]
- Tanaka, H., & Okada, K. 2024, ApJ, 968, 28 [Google Scholar]
- Turner, N. J., Fromang, S., Gammie, C., et al. 2014, in Protostars and Planets VI, eds. H. Beuther, R. S. Klessen, C. P. Dullemond, & T. Henning, 411 [Google Scholar]
- Venturini, J., Guilera, O. M., Ronco, M. P., & Mordasini, C. 2020, A&A, 644, A174 [NASA ADS] [CrossRef] [EDP Sciences] [Google Scholar]
- Weber, P., Benítez-Llambay, P., Gressel, O., Krapp, L., & Pessah, M. E. 2018, ApJ, 854, 153 [NASA ADS] [CrossRef] [Google Scholar]
- Weber, P., Pérez, S., Benítez-Llambay, P., et al. 2019, ApJ, 884, 178 [NASA ADS] [CrossRef] [Google Scholar]
- Youdin, A. N., & Lithwick, Y. 2007, Icarus, 192, 588 [NASA ADS] [CrossRef] [Google Scholar]
- Ziampras, A., Paardekooper, S.-J., & Nelson, R. P. 2023, MNRAS, 525, 5893 [CrossRef] [Google Scholar]
All Figures
|
Fig. 1 Relative perturbation of dust density for a Stokes number St = 0.55 (representative of the gravity-dominated regime), generated by an Earth-mass planet (Mp = 1.5 M⊕). The solid gray lines show the dust streamlines. All images are shown for a time of t = 50 orbits. It should be noted that when the dust diffusion is not included (upper left panel), the formation of the dust-void behind the planet and the dust filament in front of the planet exhibit the same structure, as reported in Fig. 1 (case c), of Benítez-Llambay & Pessah (2018). However, when dust diffusion increases, the dust-void and filament eventually disappear (see bottom-right panel). |
| In the text | |
|
Fig. 2 Temporal evolution of the dust (top row) and total (bottom row) torques on a planet of mass Mp = 1.5 M⊕ for representative cases of the gas-dominated (left), transitional (middle) and gravity-dominated (right) regimes. |
| In the text | |
|
Fig. 3 2D dust-void structure for three different values of δ in the gas-dominated regime (St = 0.04), for a planet with Mp = 1.5 M⊕. Top: case without dust turbulent diffusion in a viscous gas disk, which is similar to the case a) studied in Benítez-Llambay & Pessah (2018, their figure 1). Middle: case of an inviscid gaseous disk (α = 0) without dust turbulent diffusion (δ = 0). Bottom: dust-void and filament are destroyed for δ = 3 × 10⁻³. Snapshots at t = 50 orbits. |
| In the text | |
|
Fig. 4 3D dust-void structure for three different values of δ in the gas-dominated regime (St = 0.04), for a planet with Mp = 1.5M⊕. Top: snapshot (calculated at t = 70 orbits) in the case of δ = 10−5. A low-density trench forms in front of the planet instead of a filament. Middle: case with δ = 10−4. The dust-void structure resembles the shape found in 2D simulations but without the high-density ring-shaped barrier. Bottom: dust-void and filament disappearing for δ = 3 × 10⁻³ (snapshot calculated at t = 100 orbits). |
| In the text | |
|
Fig. 5 Relative perturbation of dust density at the midplane of the disk for α = δ = 10−4 (top) and α = δ = 3 × 10⁻³ (bottom) calculated at t = 100 orbits. Three different planetary masses in the transitional regime (St = 0.26) are considered (see the labels of individual panels). Note: the planet is located at the center of each plot. |
| In the text | |
|
Fig. 6 Temporal evolution of the semimajor axis of a planet with Mp = 1.5 M⊕ embedded in a purely gaseous 3D disk (top) and in 3D dusty disks representative of the gas-dominated, transitional, and gravity-dominated regimes ((second, third, and bottom panel, respectively). |
| In the text | |
|
Fig. 7 Temporal evolution of the migration rate |
| In the text | |
|
Fig. 8 Temporal evolution of the orbital parameters for the planets of larger mass migrating in a 3D dusty disk including δ = 10−4 and δ = 3 × 10⁻³ for the transitional regime with St = 0.26. Left. Semimajor axis a. Center. Migration rate |
| In the text | |
|
Fig. A.1 Colatitude resolution ratio for the models with a dust aspect ratio less than 0.1hg. Note: in the domain between |
| In the text | |
|
Fig. A.2 Comparison of the temporal evolution of the semimajor axis of a planet of mass Mp = 3.0M⊕ for α = δ = 10−4 and St = 0.26 using prescriptions 1) and 2) for the resolution of the grid in the vertical component (magenta and purple lines, respectively). |
| In the text | |
Current usage metrics show cumulative count of Article Views (full-text article views including HTML views, PDF and ePub downloads, according to the available data) and Abstracts Views on Vision4Press platform.
Data correspond to usage on the plateform after 2015. The current usage metrics is available 48-96 hours after online publication and is updated daily on week days.
Initial download of the metrics may take a while.