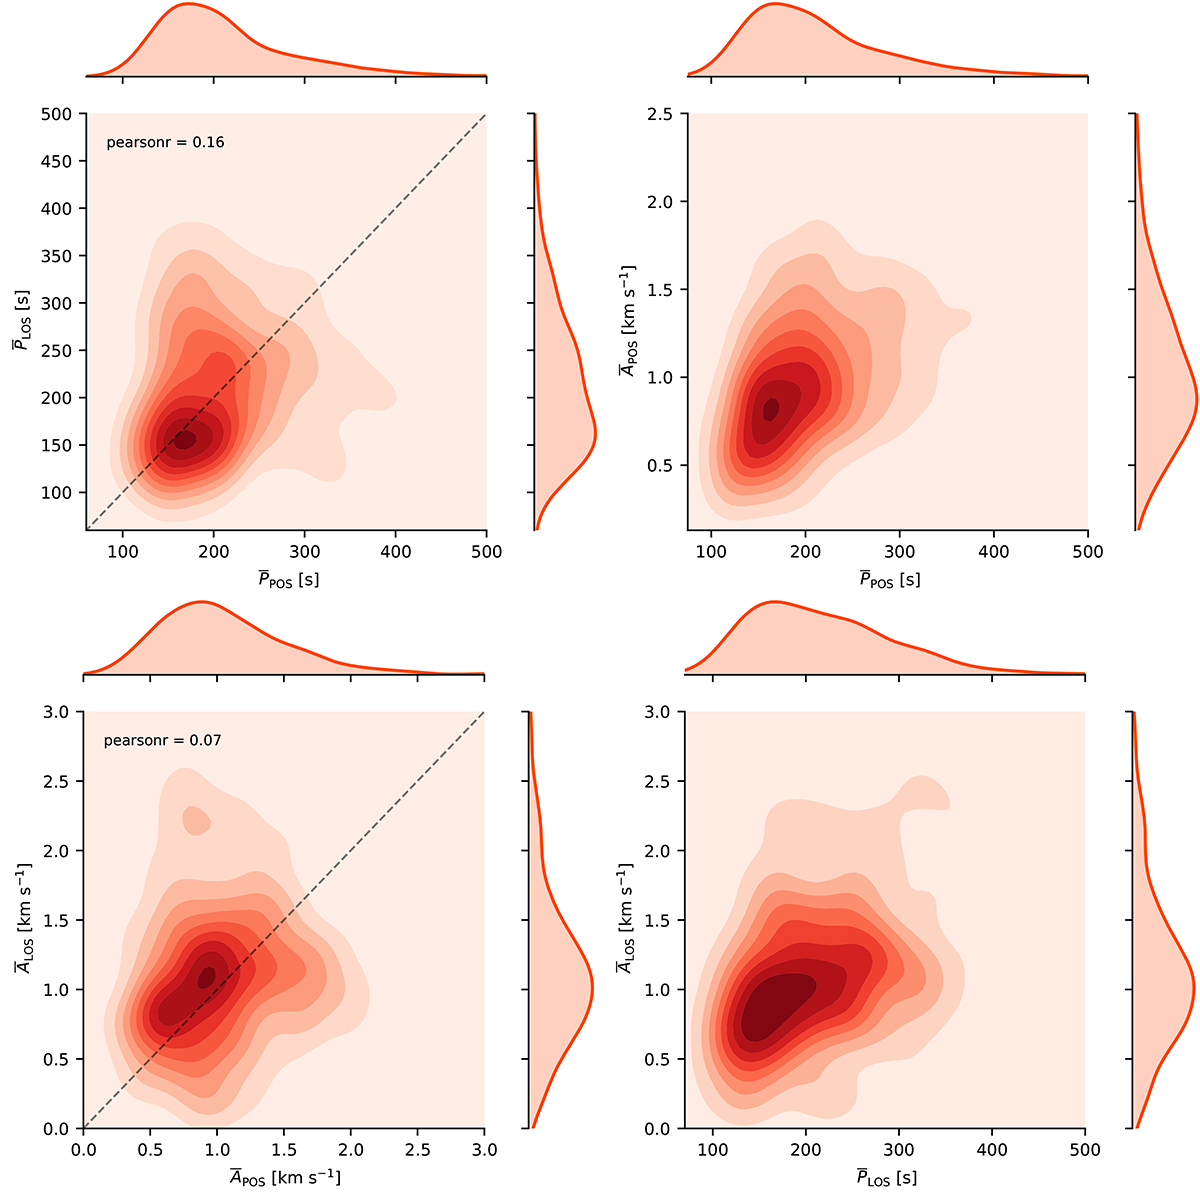
Fig. 9.
Download original image
Kernel density estimate (KDE) plots and histograms of the average period, ![]() , and average amplitude,
, and average amplitude, ![]() , of the 468 fibrils in our sample that show POS and LOS oscillations. The panels display the quantities indicated in the axis labels. The histogram distribution for each quantity is shown in the side plots that correspond to their axis. The Pearson correlation coefficient, r, is given in the corner of the left-hand panels.
, of the 468 fibrils in our sample that show POS and LOS oscillations. The panels display the quantities indicated in the axis labels. The histogram distribution for each quantity is shown in the side plots that correspond to their axis. The Pearson correlation coefficient, r, is given in the corner of the left-hand panels.
Current usage metrics show cumulative count of Article Views (full-text article views including HTML views, PDF and ePub downloads, according to the available data) and Abstracts Views on Vision4Press platform.
Data correspond to usage on the plateform after 2015. The current usage metrics is available 48-96 hours after online publication and is updated daily on week days.
Initial download of the metrics may take a while.