Fig. 7.
Download original image
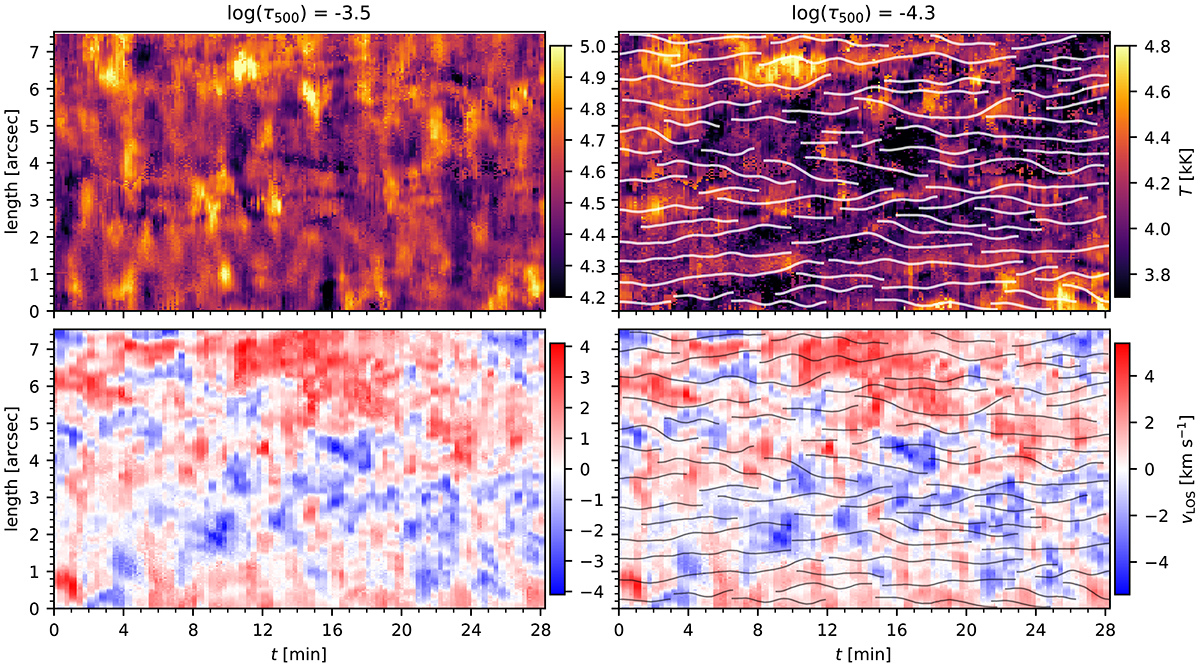
Time evolution of the physical properties of the example cross-cut shown in Fig. 2. The left column shows the inversion results in the lower chromosphere and the right column represents the results higher in the chromosphere. The top panels show the temperature of the cut in the chromosphere. The bottom panels show space-time images of the LOS velocity. The POS oscillations are overplotted on the right panels. The zero point of the cut length is marked with a white dot in Fig. 1.
Current usage metrics show cumulative count of Article Views (full-text article views including HTML views, PDF and ePub downloads, according to the available data) and Abstracts Views on Vision4Press platform.
Data correspond to usage on the plateform after 2015. The current usage metrics is available 48-96 hours after online publication and is updated daily on week days.
Initial download of the metrics may take a while.