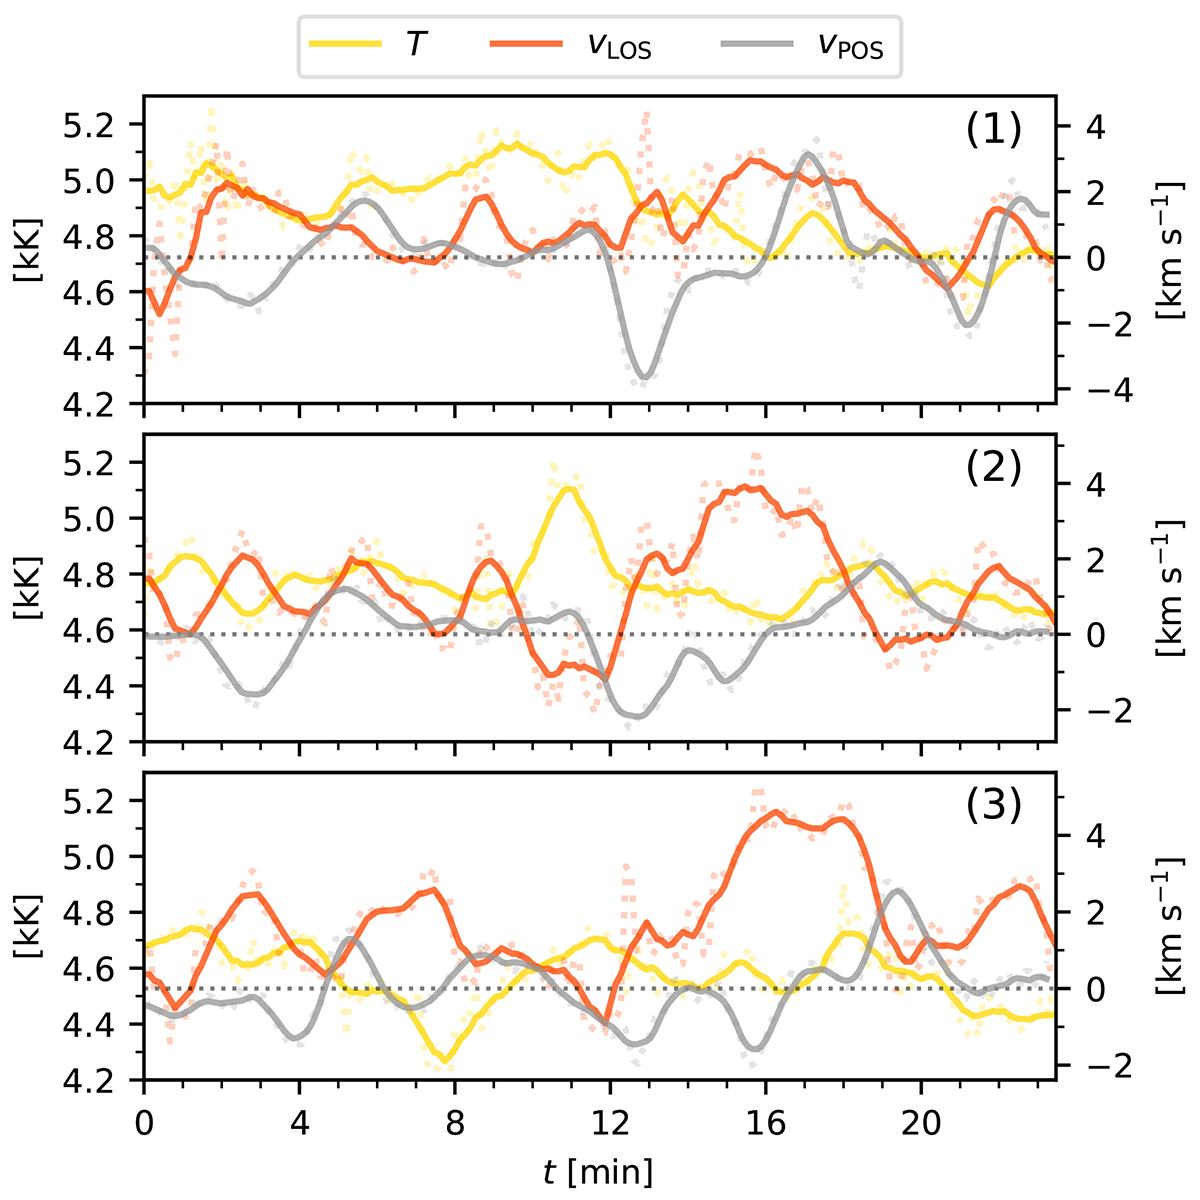
Fig. 6.
Download original image
Variations of the temperature (yellow line) and vLOS (orange line) of the perpendicular cross-cuts shown in Fig. 3. They are plotted based on their values extracted along the oscillation trajectory in POS marked in Fig. 4 at the depth log(τ500 nm) = −4.31 (i.e. where the Ca II K line is most sensitive to atmospheric perturbations). The oscillation of vPOS is plotted in grey for comparison.
Current usage metrics show cumulative count of Article Views (full-text article views including HTML views, PDF and ePub downloads, according to the available data) and Abstracts Views on Vision4Press platform.
Data correspond to usage on the plateform after 2015. The current usage metrics is available 48-96 hours after online publication and is updated daily on week days.
Initial download of the metrics may take a while.