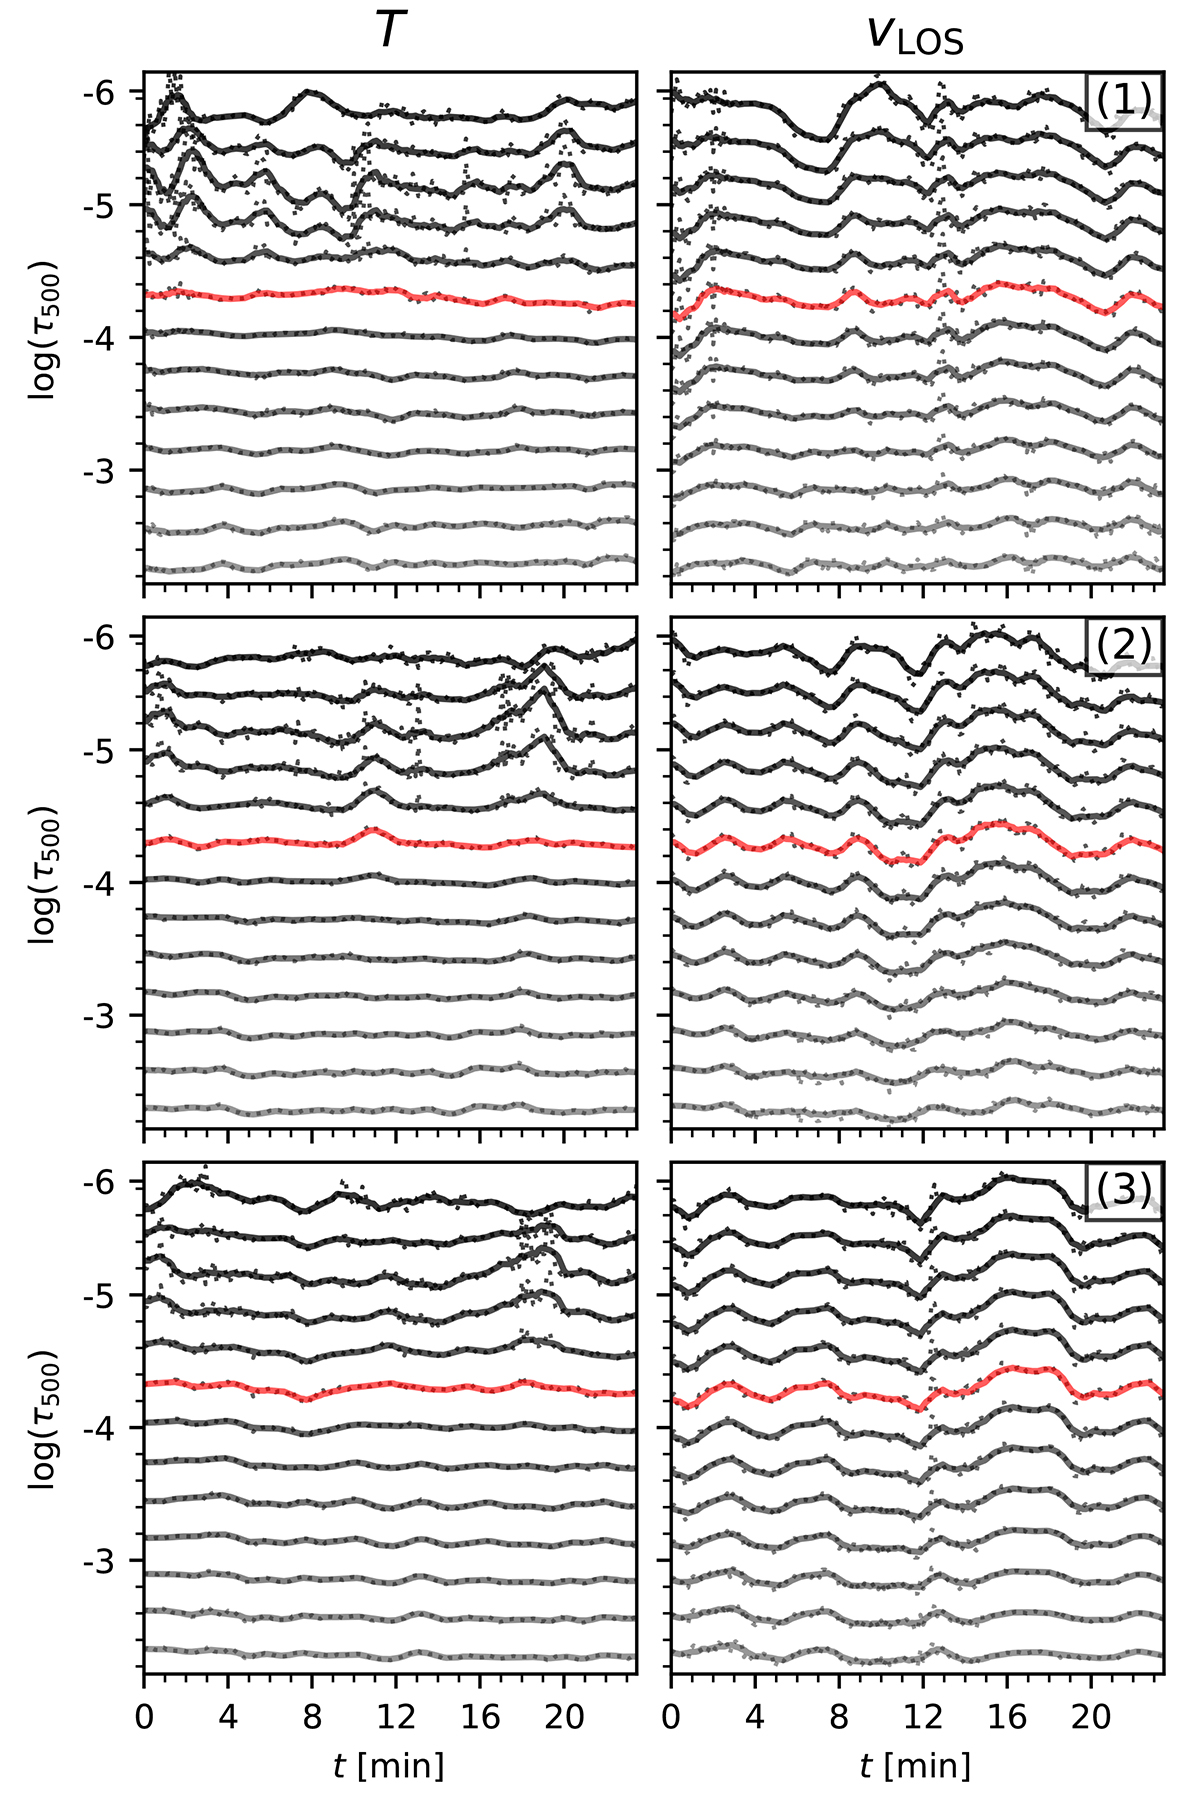
Fig. 5.
Download original image
Temperature (left column) and vLOS (right column) variations of the three cuts marked in Fig. 3 over time. The panels show the temperature and vLOS variations along the POS oscillation trajectory (marked in Fig. 4) for a depth range where Ca II K is sensitive to the perturbations in the atmosphere. Solid curves are the smoothed plots of the actual values that are shown with dots. Red curves mark the depth where Ca II K has the highest sensitivity to atmospheric perturbations. These curves are plotted individually in Fig. 6.
Current usage metrics show cumulative count of Article Views (full-text article views including HTML views, PDF and ePub downloads, according to the available data) and Abstracts Views on Vision4Press platform.
Data correspond to usage on the plateform after 2015. The current usage metrics is available 48-96 hours after online publication and is updated daily on week days.
Initial download of the metrics may take a while.