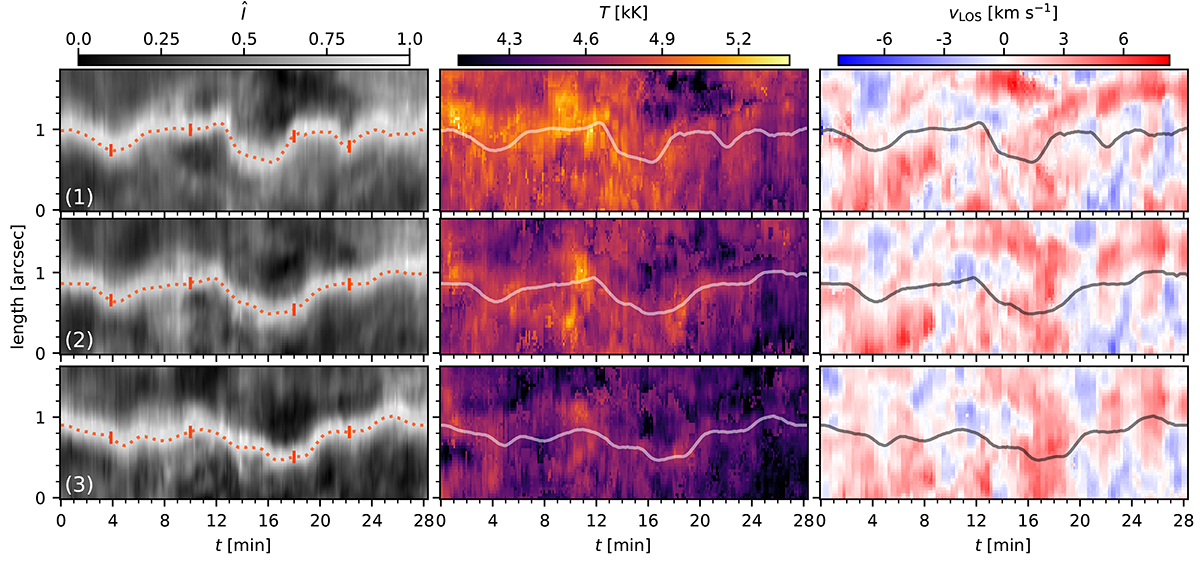
Fig. 4.
Download original image
Physical properties of the cross-cuts marked in Fig. 3. The left column shows the intensity-over-time variations of the cuts at the Ca II K nominal line centre. The oscillation in the POS is marked by dotted red curves. The middle and right columns display the temperature and vLOS variations of the cuts as a function of time in the chromosphere (log(τ500 nm) = −4.31). The POS oscillation is overplotted on these images as well. Length zero on the y-axis is where the cuts are marked by numbers in Fig. 3. The vertical line (|) symbols, marked on the curves in the left column, show the specific times of the fibril’s evolution that are displayed in Fig. 3.
Current usage metrics show cumulative count of Article Views (full-text article views including HTML views, PDF and ePub downloads, according to the available data) and Abstracts Views on Vision4Press platform.
Data correspond to usage on the plateform after 2015. The current usage metrics is available 48-96 hours after online publication and is updated daily on week days.
Initial download of the metrics may take a while.