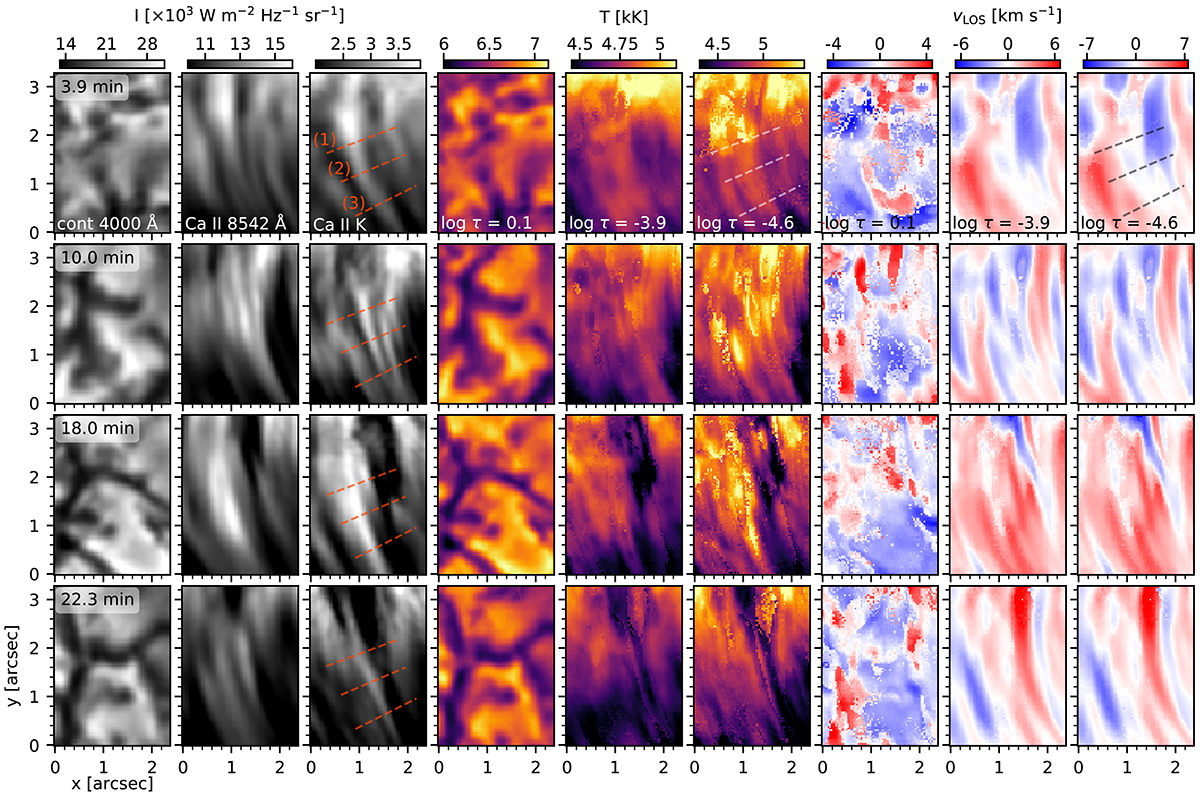
Fig. 3.
Download original image
Time evolution of the physical properties of the RoI marked with a red box in Fig. 1. Left panels: Intensity variation over time (from top to bottom) at the 4000 Å continuum, and in the line cores of Ca II 8542 Å and Ca II K. Middle and right panels: Time evolution of the temperature and vLOS at a photospheric depth (log(τ500 nm) = 0.1) and two different chromospheric depths, log(τ500 nm) = −3.9 and −4.6. Three cuts across the head, middle, and the tail of this fibril are marked and numbered and their properties as a function of time are displayed in Fig. 4.
Current usage metrics show cumulative count of Article Views (full-text article views including HTML views, PDF and ePub downloads, according to the available data) and Abstracts Views on Vision4Press platform.
Data correspond to usage on the plateform after 2015. The current usage metrics is available 48-96 hours after online publication and is updated daily on week days.
Initial download of the metrics may take a while.